Swiss vs Apache No Vehicles in Household
COMPARE
Swiss
Apache
No Vehicles in Household
No Vehicles in Household Comparison
Swiss
Apache
7.9%
NO VEHICLES IN HOUSEHOLD
99.9/ 100
METRIC RATING
42nd/ 347
METRIC RANK
11.0%
NO VEHICLES IN HOUSEHOLD
14.8/ 100
METRIC RATING
210th/ 347
METRIC RANK
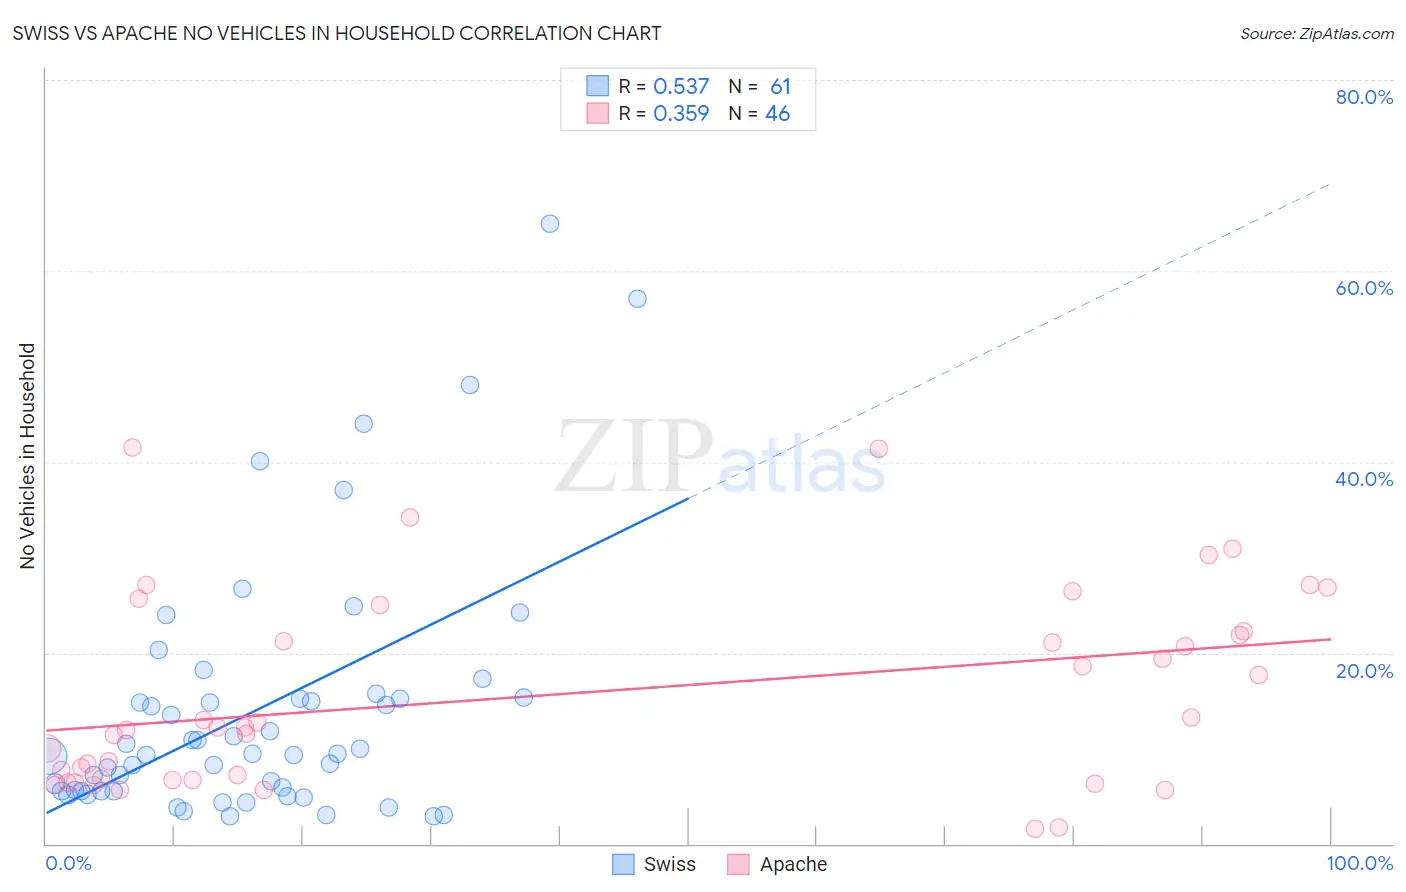
Swiss vs Apache No Vehicles in Household Correlation Chart
The statistical analysis conducted on geographies consisting of 462,788,069 people shows a substantial positive correlation between the proportion of Swiss and percentage of households with no vehicle available in the United States with a correlation coefficient (R) of 0.537 and weighted average of 7.9%. Similarly, the statistical analysis conducted on geographies consisting of 230,777,431 people shows a mild positive correlation between the proportion of Apache and percentage of households with no vehicle available in the United States with a correlation coefficient (R) of 0.359 and weighted average of 11.0%, a difference of 40.3%.
No Vehicles in Household Correlation Summary
| Measurement | Swiss | Apache |
| Minimum | 2.8% | 1.5% |
| Maximum | 65.0% | 41.5% |
| Range | 62.2% | 40.0% |
| Mean | 14.0% | 15.6% |
| Median | 9.4% | 12.2% |
| Interquartile 25% (IQ1) | 5.5% | 6.7% |
| Interquartile 75% (IQ3) | 15.2% | 22.2% |
| Interquartile Range (IQR) | 9.7% | 15.5% |
| Standard Deviation (Sample) | 13.3% | 10.3% |
| Standard Deviation (Population) | 13.1% | 10.2% |
Similar Demographics by No Vehicles in Household
Demographics Similar to Swiss by No Vehicles in Household
In terms of no vehicles in household, the demographic groups most similar to Swiss are Chickasaw (7.9%, a difference of 0.080%), French Canadian (7.8%, a difference of 0.14%), Czechoslovakian (7.8%, a difference of 0.28%), Immigrants from Fiji (7.8%, a difference of 0.38%), and Choctaw (7.9%, a difference of 0.44%).
| Demographics | Rating | Rank | No Vehicles in Household |
| Cherokee | 99.9 /100 | #35 | Exceptional 7.7% |
| Iraqis | 99.9 /100 | #36 | Exceptional 7.7% |
| Basques | 99.9 /100 | #37 | Exceptional 7.8% |
| Creek | 99.9 /100 | #38 | Exceptional 7.8% |
| Immigrants | Fiji | 99.9 /100 | #39 | Exceptional 7.8% |
| Czechoslovakians | 99.9 /100 | #40 | Exceptional 7.8% |
| French Canadians | 99.9 /100 | #41 | Exceptional 7.8% |
| Swiss | 99.9 /100 | #42 | Exceptional 7.9% |
| Chickasaw | 99.9 /100 | #43 | Exceptional 7.9% |
| Choctaw | 99.9 /100 | #44 | Exceptional 7.9% |
| Immigrants | Nonimmigrants | 99.9 /100 | #45 | Exceptional 7.9% |
| Spanish | 99.9 /100 | #46 | Exceptional 7.9% |
| Northern Europeans | 99.9 /100 | #47 | Exceptional 7.9% |
| Afghans | 99.9 /100 | #48 | Exceptional 8.0% |
| Guamanians/Chamorros | 99.9 /100 | #49 | Exceptional 8.0% |
Demographics Similar to Apache by No Vehicles in Household
In terms of no vehicles in household, the demographic groups most similar to Apache are Pennsylvania German (11.0%, a difference of 0.16%), Crow (11.0%, a difference of 0.16%), Immigrants from Italy (11.0%, a difference of 0.19%), Sierra Leonean (11.0%, a difference of 0.21%), and Immigrants from Western Asia (11.0%, a difference of 0.25%).
| Demographics | Rating | Rank | No Vehicles in Household |
| Iroquois | 17.6 /100 | #203 | Poor 10.9% |
| Guatemalans | 16.1 /100 | #204 | Poor 11.0% |
| Immigrants | Chile | 15.9 /100 | #205 | Poor 11.0% |
| Somalis | 15.9 /100 | #206 | Poor 11.0% |
| Sierra Leoneans | 15.7 /100 | #207 | Poor 11.0% |
| Immigrants | Italy | 15.6 /100 | #208 | Poor 11.0% |
| Pennsylvania Germans | 15.5 /100 | #209 | Poor 11.0% |
| Apache | 14.8 /100 | #210 | Poor 11.0% |
| Crow | 14.2 /100 | #211 | Poor 11.0% |
| Immigrants | Western Asia | 13.9 /100 | #212 | Poor 11.0% |
| Immigrants | Hungary | 12.3 /100 | #213 | Poor 11.1% |
| Immigrants | Denmark | 12.1 /100 | #214 | Poor 11.1% |
| Immigrants | Sri Lanka | 10.6 /100 | #215 | Poor 11.2% |
| Immigrants | Argentina | 10.6 /100 | #216 | Poor 11.2% |
| Dutch West Indians | 10.2 /100 | #217 | Poor 11.2% |