Tohono O'odham vs Iroquois 4 or more Vehicles in Household
COMPARE
Tohono O'odham
Iroquois
4 or more Vehicles in Household
4 or more Vehicles in Household Comparison
Tohono O'odham
Iroquois
6.6%
4 OR MORE VEHICLES IN HOUSEHOLD
86.7/ 100
METRIC RATING
135th/ 347
METRIC RANK
6.5%
4 OR MORE VEHICLES IN HOUSEHOLD
70.4/ 100
METRIC RATING
155th/ 347
METRIC RANK
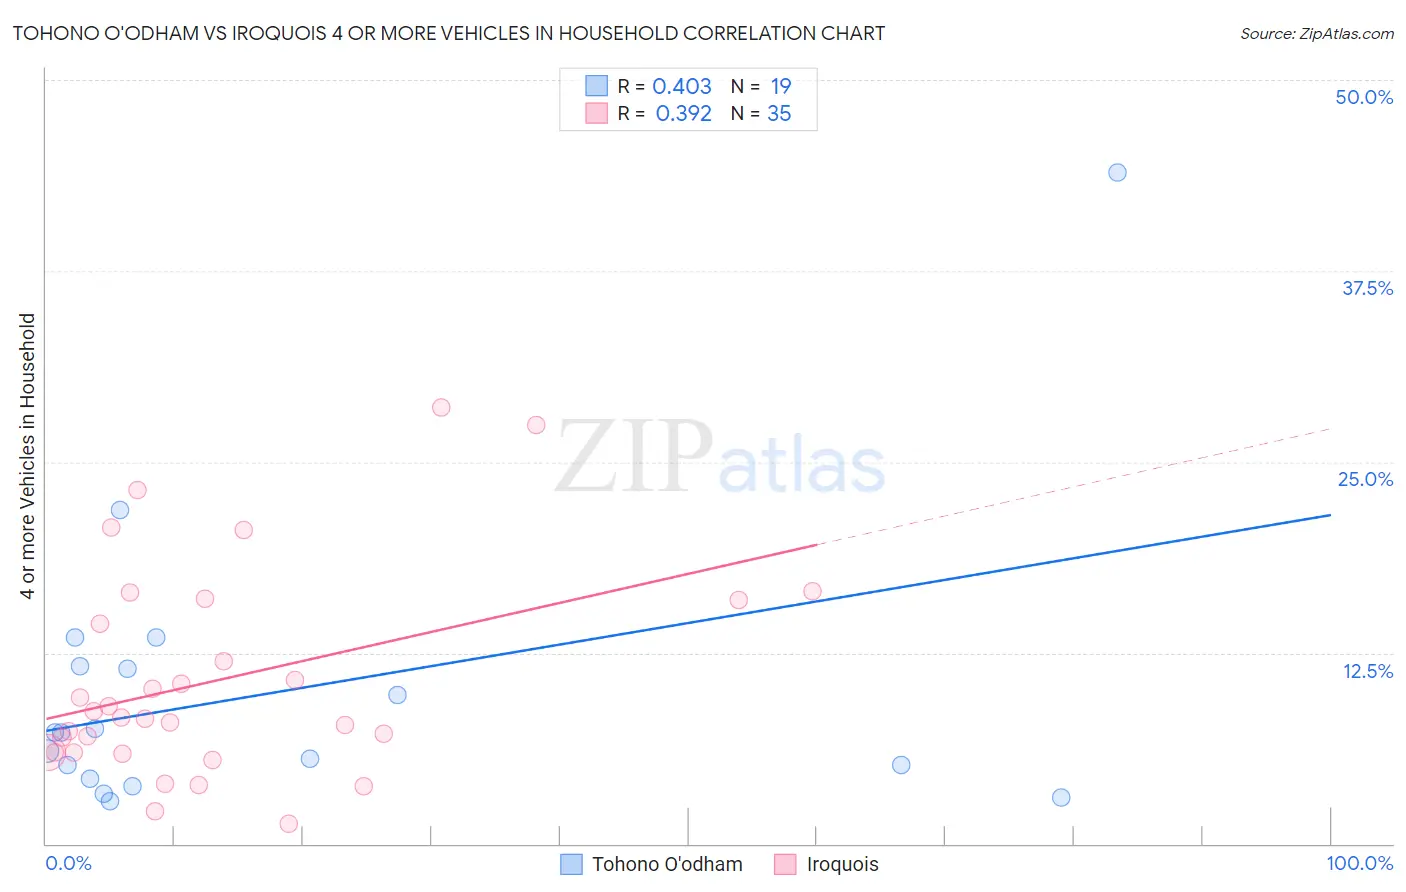
Tohono O'odham vs Iroquois 4 or more Vehicles in Household Correlation Chart
The statistical analysis conducted on geographies consisting of 58,702,005 people shows a moderate positive correlation between the proportion of Tohono O'odham and percentage of households with 4 or more vehicles available in the United States with a correlation coefficient (R) of 0.403 and weighted average of 6.6%. Similarly, the statistical analysis conducted on geographies consisting of 206,658,365 people shows a mild positive correlation between the proportion of Iroquois and percentage of households with 4 or more vehicles available in the United States with a correlation coefficient (R) of 0.392 and weighted average of 6.5%, a difference of 2.5%.
4 or more Vehicles in Household Correlation Summary
| Measurement | Tohono O'odham | Iroquois |
| Minimum | 2.8% | 1.3% |
| Maximum | 43.9% | 28.6% |
| Range | 41.1% | 27.3% |
| Mean | 9.8% | 10.7% |
| Median | 7.3% | 8.3% |
| Interquartile 25% (IQ1) | 4.3% | 6.0% |
| Interquartile 75% (IQ3) | 11.6% | 15.9% |
| Interquartile Range (IQR) | 7.3% | 9.9% |
| Standard Deviation (Sample) | 9.5% | 6.9% |
| Standard Deviation (Population) | 9.3% | 6.8% |
Demographics Similar to Tohono O'odham and Iroquois by 4 or more Vehicles in Household
In terms of 4 or more vehicles in household, the demographic groups most similar to Tohono O'odham are Luxembourger (6.6%, a difference of 0.070%), French Canadian (6.6%, a difference of 0.27%), Italian (6.6%, a difference of 0.43%), Jordanian (6.6%, a difference of 0.87%), and Slavic (6.6%, a difference of 0.95%). Similarly, the demographic groups most similar to Iroquois are Central American Indian (6.5%, a difference of 0.080%), Immigrants from Armenia (6.5%, a difference of 0.090%), Yuman (6.5%, a difference of 0.21%), Immigrants from Hong Kong (6.5%, a difference of 0.22%), and New Zealander (6.5%, a difference of 0.36%).
| Demographics | Rating | Rank | 4 or more Vehicles in Household |
| Tohono O'odham | 86.7 /100 | #135 | Excellent 6.6% |
| Luxembourgers | 86.4 /100 | #136 | Excellent 6.6% |
| French Canadians | 85.4 /100 | #137 | Excellent 6.6% |
| Italians | 84.5 /100 | #138 | Excellent 6.6% |
| Jordanians | 82.1 /100 | #139 | Excellent 6.6% |
| Slavs | 81.6 /100 | #140 | Excellent 6.6% |
| Australians | 80.8 /100 | #141 | Excellent 6.6% |
| Immigrants | Iraq | 79.4 /100 | #142 | Good 6.5% |
| Immigrants | Canada | 78.6 /100 | #143 | Good 6.5% |
| Immigrants | North America | 78.5 /100 | #144 | Good 6.5% |
| Croatians | 77.8 /100 | #145 | Good 6.5% |
| Immigrants | Costa Rica | 74.4 /100 | #146 | Good 6.5% |
| Immigrants | Iran | 73.9 /100 | #147 | Good 6.5% |
| Immigrants | Jordan | 73.7 /100 | #148 | Good 6.5% |
| Greeks | 73.6 /100 | #149 | Good 6.5% |
| New Zealanders | 73.3 /100 | #150 | Good 6.5% |
| Immigrants | Hong Kong | 72.2 /100 | #151 | Good 6.5% |
| Yuman | 72.1 /100 | #152 | Good 6.5% |
| Immigrants | Armenia | 71.2 /100 | #153 | Good 6.5% |
| Central American Indians | 71.1 /100 | #154 | Good 6.5% |
| Iroquois | 70.4 /100 | #155 | Good 6.5% |