Sudanese vs Immigrants from Caribbean In Labor Force | Age > 16
COMPARE
Sudanese
Immigrants from Caribbean
In Labor Force | Age > 16
In Labor Force | Age > 16 Comparison
Sudanese
Immigrants from Caribbean
68.0%
IN LABOR FORCE | AGE > 16
100.0/ 100
METRIC RATING
12th/ 347
METRIC RANK
64.4%
IN LABOR FORCE | AGE > 16
2.3/ 100
METRIC RATING
246th/ 347
METRIC RANK
Sudanese vs Immigrants from Caribbean In Labor Force | Age > 16 Correlation Chart
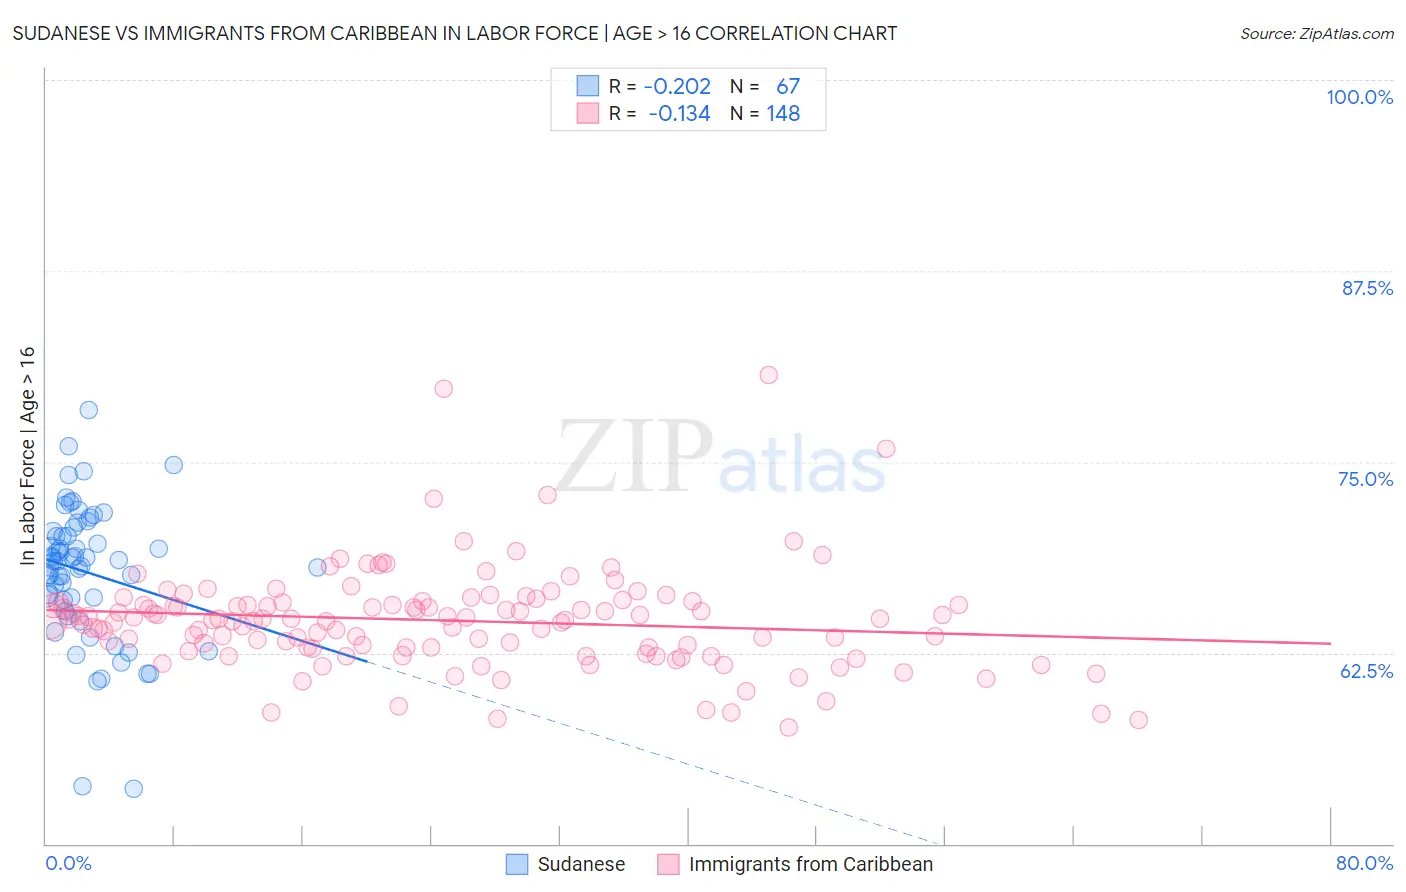
The statistical analysis conducted on geographies consisting of 110,150,876 people shows a weak negative correlation between the proportion of Sudanese and labor force participation rate among population ages 16 and over in the United States with a correlation coefficient (R) of -0.202 and weighted average of 68.0%. Similarly, the statistical analysis conducted on geographies consisting of 450,044,170 people shows a poor negative correlation between the proportion of Immigrants from Caribbean and labor force participation rate among population ages 16 and over in the United States with a correlation coefficient (R) of -0.134 and weighted average of 64.4%, a difference of 5.6%.
In Labor Force | Age > 16 Correlation Summary
| Measurement | Sudanese | Immigrants from Caribbean |
| Minimum | 53.6% | 57.6% |
| Maximum | 78.4% | 80.7% |
| Range | 24.8% | 23.1% |
| Mean | 67.8% | 64.6% |
| Median | 68.5% | 64.7% |
| Interquartile 25% (IQ1) | 65.9% | 62.8% |
| Interquartile 75% (IQ3) | 70.4% | 65.8% |
| Interquartile Range (IQR) | 4.5% | 3.0% |
| Standard Deviation (Sample) | 4.5% | 3.4% |
| Standard Deviation (Population) | 4.5% | 3.3% |
Similar Demographics by In Labor Force | Age > 16
Demographics Similar to Sudanese by In Labor Force | Age > 16
In terms of in labor force | age > 16, the demographic groups most similar to Sudanese are Immigrants from Nepal (68.0%, a difference of 0.020%), Bolivian (68.2%, a difference of 0.22%), Liberian (67.8%, a difference of 0.38%), Immigrants from Middle Africa (67.7%, a difference of 0.44%), and Immigrants from Sudan (67.7%, a difference of 0.54%).
| Demographics | Rating | Rank | In Labor Force | Age > 16 |
| Sierra Leoneans | 100.0 /100 | #5 | Exceptional 68.9% |
| Immigrants | Eritrea | 100.0 /100 | #6 | Exceptional 68.9% |
| Immigrants | Cameroon | 100.0 /100 | #7 | Exceptional 68.7% |
| Immigrants | Sierra Leone | 100.0 /100 | #8 | Exceptional 68.5% |
| Immigrants | Eastern Africa | 100.0 /100 | #9 | Exceptional 68.5% |
| Immigrants | Bolivia | 100.0 /100 | #10 | Exceptional 68.4% |
| Bolivians | 100.0 /100 | #11 | Exceptional 68.2% |
| Sudanese | 100.0 /100 | #12 | Exceptional 68.0% |
| Immigrants | Nepal | 100.0 /100 | #13 | Exceptional 68.0% |
| Liberians | 100.0 /100 | #14 | Exceptional 67.8% |
| Immigrants | Middle Africa | 100.0 /100 | #15 | Exceptional 67.7% |
| Immigrants | Sudan | 100.0 /100 | #16 | Exceptional 67.7% |
| Immigrants | India | 100.0 /100 | #17 | Exceptional 67.6% |
| Immigrants | Liberia | 100.0 /100 | #18 | Exceptional 67.6% |
| Kenyans | 100.0 /100 | #19 | Exceptional 67.6% |
Demographics Similar to Immigrants from Caribbean by In Labor Force | Age > 16
In terms of in labor force | age > 16, the demographic groups most similar to Immigrants from Caribbean are Swiss (64.4%, a difference of 0.020%), Immigrants from Barbados (64.4%, a difference of 0.030%), German (64.4%, a difference of 0.060%), British West Indian (64.4%, a difference of 0.070%), and West Indian (64.5%, a difference of 0.080%).
| Demographics | Rating | Rank | In Labor Force | Age > 16 |
| Immigrants | Hungary | 3.8 /100 | #239 | Tragic 64.5% |
| Immigrants | Bangladesh | 3.6 /100 | #240 | Tragic 64.5% |
| Immigrants | Dominica | 3.5 /100 | #241 | Tragic 64.5% |
| Immigrants | Netherlands | 3.4 /100 | #242 | Tragic 64.5% |
| Immigrants | Lebanon | 3.2 /100 | #243 | Tragic 64.5% |
| Tsimshian | 3.1 /100 | #244 | Tragic 64.5% |
| West Indians | 3.0 /100 | #245 | Tragic 64.5% |
| Immigrants | Caribbean | 2.3 /100 | #246 | Tragic 64.4% |
| Swiss | 2.1 /100 | #247 | Tragic 64.4% |
| Immigrants | Barbados | 2.1 /100 | #248 | Tragic 64.4% |
| Germans | 1.8 /100 | #249 | Tragic 64.4% |
| British West Indians | 1.8 /100 | #250 | Tragic 64.4% |
| Portuguese | 1.6 /100 | #251 | Tragic 64.4% |
| Immigrants | Dominican Republic | 1.5 /100 | #252 | Tragic 64.4% |
| Czechoslovakians | 1.4 /100 | #253 | Tragic 64.3% |