Shoshone vs Immigrants from Africa 4 or more Vehicles in Household
COMPARE
Shoshone
Immigrants from Africa
4 or more Vehicles in Household
4 or more Vehicles in Household Comparison
Shoshone
Immigrants from Africa
8.8%
4 OR MORE VEHICLES IN HOUSEHOLD
100.0/ 100
METRIC RATING
15th/ 347
METRIC RANK
5.6%
4 OR MORE VEHICLES IN HOUSEHOLD
1.0/ 100
METRIC RATING
264th/ 347
METRIC RANK
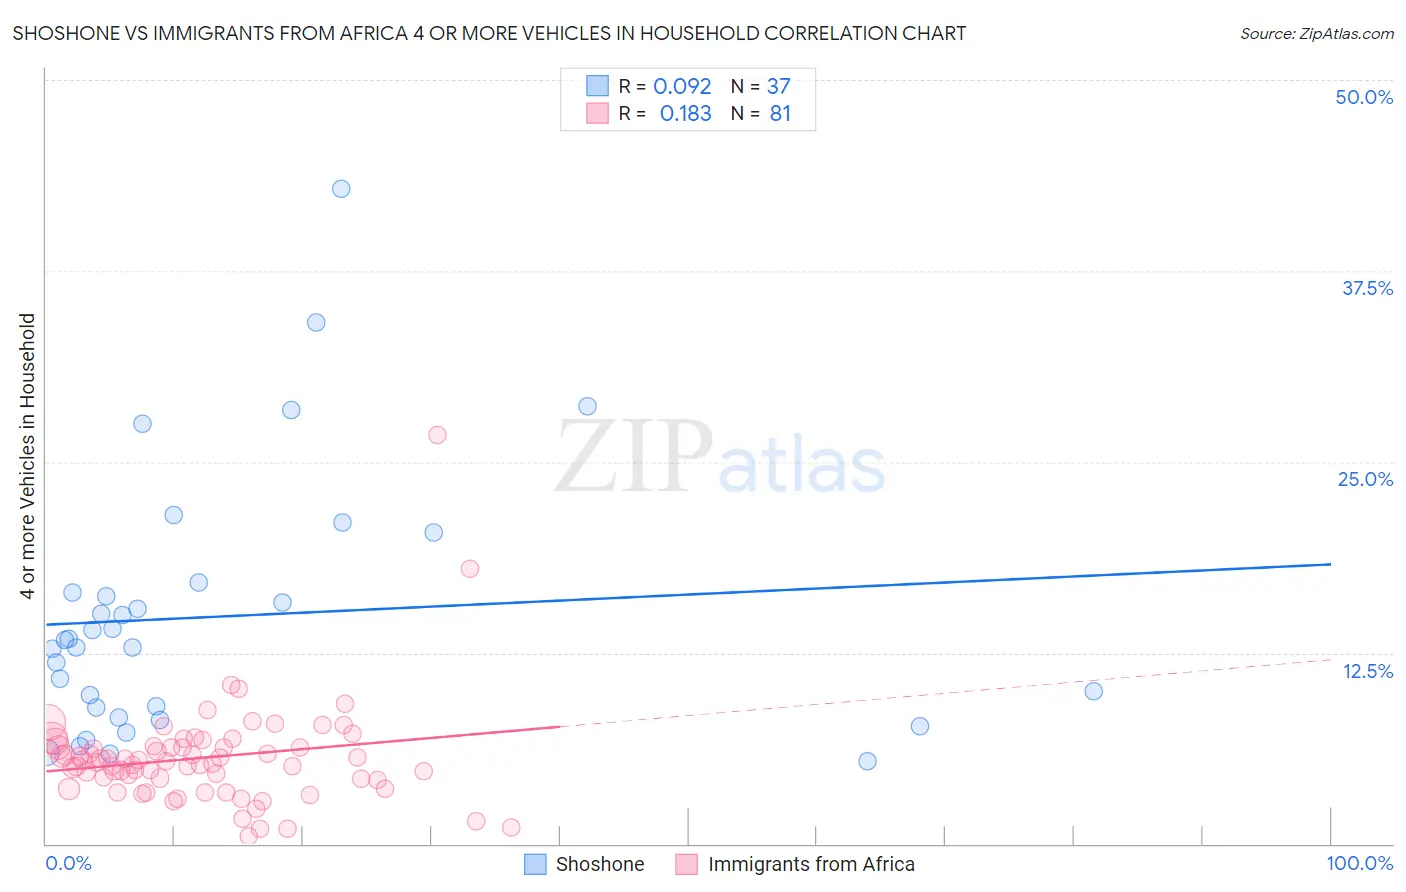
Shoshone vs Immigrants from Africa 4 or more Vehicles in Household Correlation Chart
The statistical analysis conducted on geographies consisting of 66,577,093 people shows a slight positive correlation between the proportion of Shoshone and percentage of households with 4 or more vehicles available in the United States with a correlation coefficient (R) of 0.092 and weighted average of 8.8%. Similarly, the statistical analysis conducted on geographies consisting of 466,853,730 people shows a poor positive correlation between the proportion of Immigrants from Africa and percentage of households with 4 or more vehicles available in the United States with a correlation coefficient (R) of 0.183 and weighted average of 5.6%, a difference of 58.5%.
4 or more Vehicles in Household Correlation Summary
| Measurement | Shoshone | Immigrants from Africa |
| Minimum | 5.4% | 0.46% |
| Maximum | 42.9% | 26.8% |
| Range | 37.5% | 26.3% |
| Mean | 14.9% | 5.6% |
| Median | 13.3% | 5.4% |
| Interquartile 25% (IQ1) | 8.6% | 4.2% |
| Interquartile 75% (IQ3) | 16.8% | 6.3% |
| Interquartile Range (IQR) | 8.2% | 2.1% |
| Standard Deviation (Sample) | 8.4% | 3.4% |
| Standard Deviation (Population) | 8.3% | 3.4% |
Similar Demographics by 4 or more Vehicles in Household
Demographics Similar to Shoshone by 4 or more Vehicles in Household
In terms of 4 or more vehicles in household, the demographic groups most similar to Shoshone are Chinese (8.8%, a difference of 0.030%), Lumbee (8.8%, a difference of 0.71%), Hawaiian (8.9%, a difference of 1.0%), Mexican (8.9%, a difference of 1.0%), and Ute (8.8%, a difference of 1.1%).
| Demographics | Rating | Rank | 4 or more Vehicles in Household |
| Arapaho | 100.0 /100 | #8 | Exceptional 9.4% |
| Samoans | 100.0 /100 | #9 | Exceptional 9.2% |
| Paiute | 100.0 /100 | #10 | Exceptional 9.0% |
| Immigrants | Mexico | 100.0 /100 | #11 | Exceptional 9.0% |
| Mexicans | 100.0 /100 | #12 | Exceptional 8.9% |
| Hawaiians | 100.0 /100 | #13 | Exceptional 8.9% |
| Chinese | 100.0 /100 | #14 | Exceptional 8.8% |
| Shoshone | 100.0 /100 | #15 | Exceptional 8.8% |
| Lumbee | 100.0 /100 | #16 | Exceptional 8.8% |
| Ute | 100.0 /100 | #17 | Exceptional 8.8% |
| Nepalese | 100.0 /100 | #18 | Exceptional 8.7% |
| Koreans | 100.0 /100 | #19 | Exceptional 8.6% |
| Pueblo | 100.0 /100 | #20 | Exceptional 8.6% |
| Danes | 100.0 /100 | #21 | Exceptional 8.6% |
| Immigrants | Vietnam | 100.0 /100 | #22 | Exceptional 8.6% |
Demographics Similar to Immigrants from Africa by 4 or more Vehicles in Household
In terms of 4 or more vehicles in household, the demographic groups most similar to Immigrants from Africa are South American (5.6%, a difference of 0.22%), Immigrants from Nepal (5.6%, a difference of 0.24%), Immigrants from Ukraine (5.6%, a difference of 0.32%), Immigrants from Saudi Arabia (5.6%, a difference of 0.54%), and Bermudan (5.6%, a difference of 0.63%).
| Demographics | Rating | Rank | 4 or more Vehicles in Household |
| Immigrants | Northern Africa | 1.4 /100 | #257 | Tragic 5.6% |
| Immigrants | Lithuania | 1.4 /100 | #258 | Tragic 5.6% |
| Immigrants | France | 1.3 /100 | #259 | Tragic 5.6% |
| Uruguayans | 1.3 /100 | #260 | Tragic 5.6% |
| Sudanese | 1.2 /100 | #261 | Tragic 5.6% |
| Bermudans | 1.2 /100 | #262 | Tragic 5.6% |
| Immigrants | Saudi Arabia | 1.1 /100 | #263 | Tragic 5.6% |
| Immigrants | Africa | 1.0 /100 | #264 | Tragic 5.6% |
| South Americans | 0.9 /100 | #265 | Tragic 5.6% |
| Immigrants | Nepal | 0.9 /100 | #266 | Tragic 5.6% |
| Immigrants | Ukraine | 0.9 /100 | #267 | Tragic 5.6% |
| Colombians | 0.7 /100 | #268 | Tragic 5.5% |
| Carpatho Rusyns | 0.7 /100 | #269 | Tragic 5.5% |
| Okinawans | 0.6 /100 | #270 | Tragic 5.5% |
| Immigrants | Sudan | 0.6 /100 | #271 | Tragic 5.5% |