Immigrants from Portugal vs Immigrants from Africa 4 or more Vehicles in Household
COMPARE
Immigrants from Portugal
Immigrants from Africa
4 or more Vehicles in Household
4 or more Vehicles in Household Comparison
Immigrants from Portugal
Immigrants from Africa
6.1%
4 OR MORE VEHICLES IN HOUSEHOLD
22.3/ 100
METRIC RATING
198th/ 347
METRIC RANK
5.6%
4 OR MORE VEHICLES IN HOUSEHOLD
1.0/ 100
METRIC RATING
264th/ 347
METRIC RANK
Immigrants from Portugal vs Immigrants from Africa 4 or more Vehicles in Household Correlation Chart
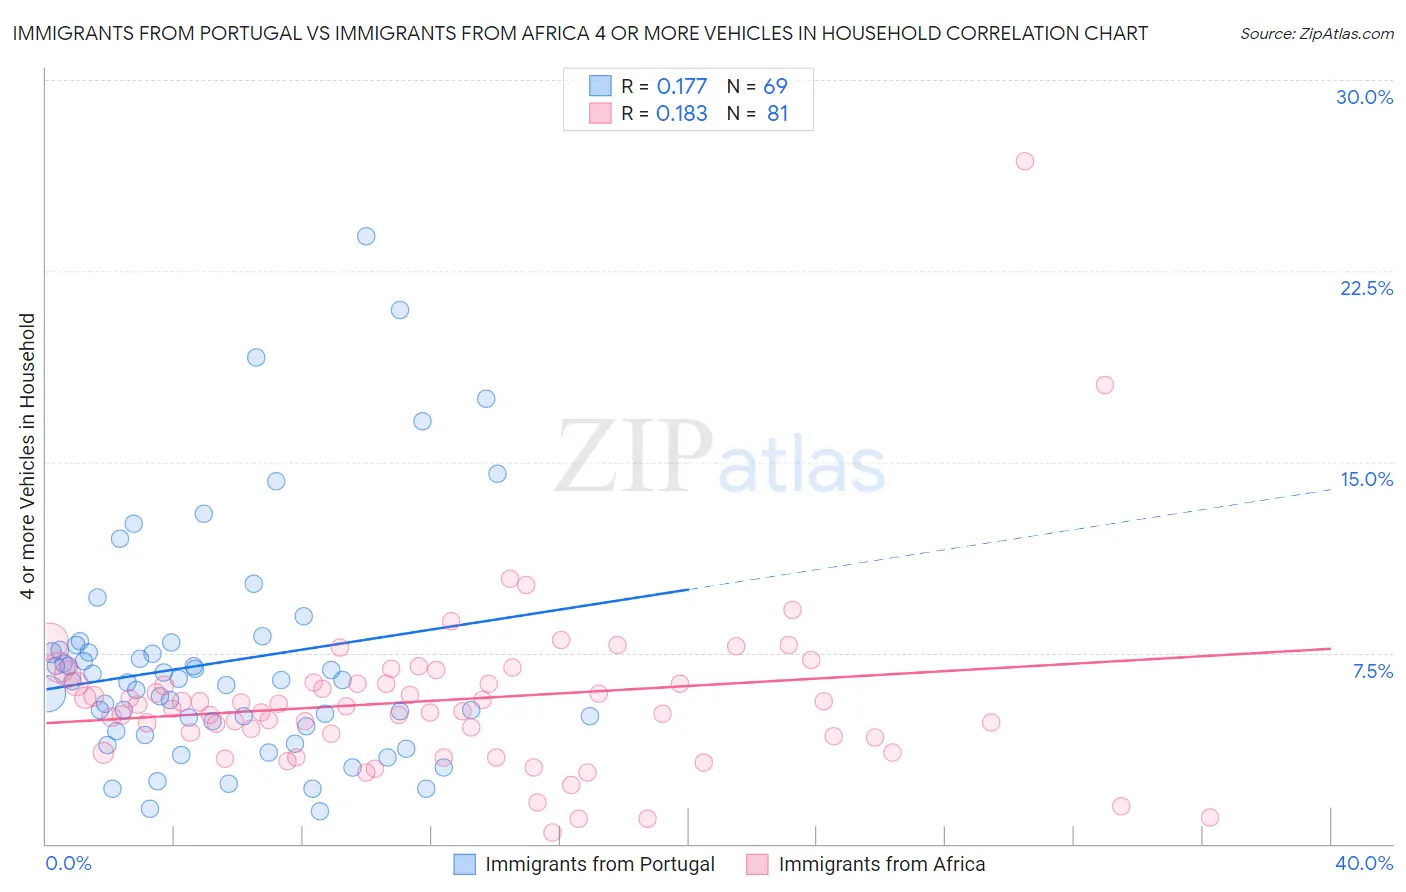
The statistical analysis conducted on geographies consisting of 173,887,312 people shows a poor positive correlation between the proportion of Immigrants from Portugal and percentage of households with 4 or more vehicles available in the United States with a correlation coefficient (R) of 0.177 and weighted average of 6.1%. Similarly, the statistical analysis conducted on geographies consisting of 466,853,730 people shows a poor positive correlation between the proportion of Immigrants from Africa and percentage of households with 4 or more vehicles available in the United States with a correlation coefficient (R) of 0.183 and weighted average of 5.6%, a difference of 9.7%.
4 or more Vehicles in Household Correlation Summary
| Measurement | Immigrants from Portugal | Immigrants from Africa |
| Minimum | 1.3% | 0.46% |
| Maximum | 23.9% | 26.8% |
| Range | 22.6% | 26.3% |
| Mean | 7.1% | 5.6% |
| Median | 6.4% | 5.4% |
| Interquartile 25% (IQ1) | 4.5% | 4.2% |
| Interquartile 75% (IQ3) | 7.7% | 6.3% |
| Interquartile Range (IQR) | 3.2% | 2.1% |
| Standard Deviation (Sample) | 4.5% | 3.4% |
| Standard Deviation (Population) | 4.5% | 3.4% |
Similar Demographics by 4 or more Vehicles in Household
Demographics Similar to Immigrants from Portugal by 4 or more Vehicles in Household
In terms of 4 or more vehicles in household, the demographic groups most similar to Immigrants from Portugal are Immigrants from Norway (6.1%, a difference of 0.080%), Latvian (6.1%, a difference of 0.090%), Egyptian (6.1%, a difference of 0.14%), Immigrants from South Central Asia (6.1%, a difference of 0.15%), and Immigrants from Sri Lanka (6.1%, a difference of 0.20%).
| Demographics | Rating | Rank | 4 or more Vehicles in Household |
| Inupiat | 30.7 /100 | #191 | Fair 6.2% |
| Romanians | 30.7 /100 | #192 | Fair 6.2% |
| Immigrants | Kuwait | 28.0 /100 | #193 | Fair 6.2% |
| Immigrants | Sweden | 27.0 /100 | #194 | Fair 6.2% |
| Argentineans | 27.0 /100 | #195 | Fair 6.2% |
| Tsimshian | 26.4 /100 | #196 | Fair 6.2% |
| Immigrants | Sri Lanka | 23.7 /100 | #197 | Fair 6.1% |
| Immigrants | Portugal | 22.3 /100 | #198 | Fair 6.1% |
| Immigrants | Norway | 21.8 /100 | #199 | Fair 6.1% |
| Latvians | 21.7 /100 | #200 | Fair 6.1% |
| Egyptians | 21.4 /100 | #201 | Fair 6.1% |
| Immigrants | South Central Asia | 21.3 /100 | #202 | Fair 6.1% |
| Immigrants | Sierra Leone | 20.5 /100 | #203 | Fair 6.1% |
| Immigrants | Belize | 19.8 /100 | #204 | Poor 6.1% |
| Hondurans | 19.3 /100 | #205 | Poor 6.1% |
Demographics Similar to Immigrants from Africa by 4 or more Vehicles in Household
In terms of 4 or more vehicles in household, the demographic groups most similar to Immigrants from Africa are South American (5.6%, a difference of 0.22%), Immigrants from Nepal (5.6%, a difference of 0.24%), Immigrants from Ukraine (5.6%, a difference of 0.32%), Immigrants from Saudi Arabia (5.6%, a difference of 0.54%), and Bermudan (5.6%, a difference of 0.63%).
| Demographics | Rating | Rank | 4 or more Vehicles in Household |
| Immigrants | Northern Africa | 1.4 /100 | #257 | Tragic 5.6% |
| Immigrants | Lithuania | 1.4 /100 | #258 | Tragic 5.6% |
| Immigrants | France | 1.3 /100 | #259 | Tragic 5.6% |
| Uruguayans | 1.3 /100 | #260 | Tragic 5.6% |
| Sudanese | 1.2 /100 | #261 | Tragic 5.6% |
| Bermudans | 1.2 /100 | #262 | Tragic 5.6% |
| Immigrants | Saudi Arabia | 1.1 /100 | #263 | Tragic 5.6% |
| Immigrants | Africa | 1.0 /100 | #264 | Tragic 5.6% |
| South Americans | 0.9 /100 | #265 | Tragic 5.6% |
| Immigrants | Nepal | 0.9 /100 | #266 | Tragic 5.6% |
| Immigrants | Ukraine | 0.9 /100 | #267 | Tragic 5.6% |
| Colombians | 0.7 /100 | #268 | Tragic 5.5% |
| Carpatho Rusyns | 0.7 /100 | #269 | Tragic 5.5% |
| Okinawans | 0.6 /100 | #270 | Tragic 5.5% |
| Immigrants | Sudan | 0.6 /100 | #271 | Tragic 5.5% |