Lithuanian vs Immigrants from Africa 4 or more Vehicles in Household
COMPARE
Lithuanian
Immigrants from Africa
4 or more Vehicles in Household
4 or more Vehicles in Household Comparison
Lithuanians
Immigrants from Africa
6.3%
4 OR MORE VEHICLES IN HOUSEHOLD
50.0/ 100
METRIC RATING
174th/ 347
METRIC RANK
5.6%
4 OR MORE VEHICLES IN HOUSEHOLD
1.0/ 100
METRIC RATING
264th/ 347
METRIC RANK
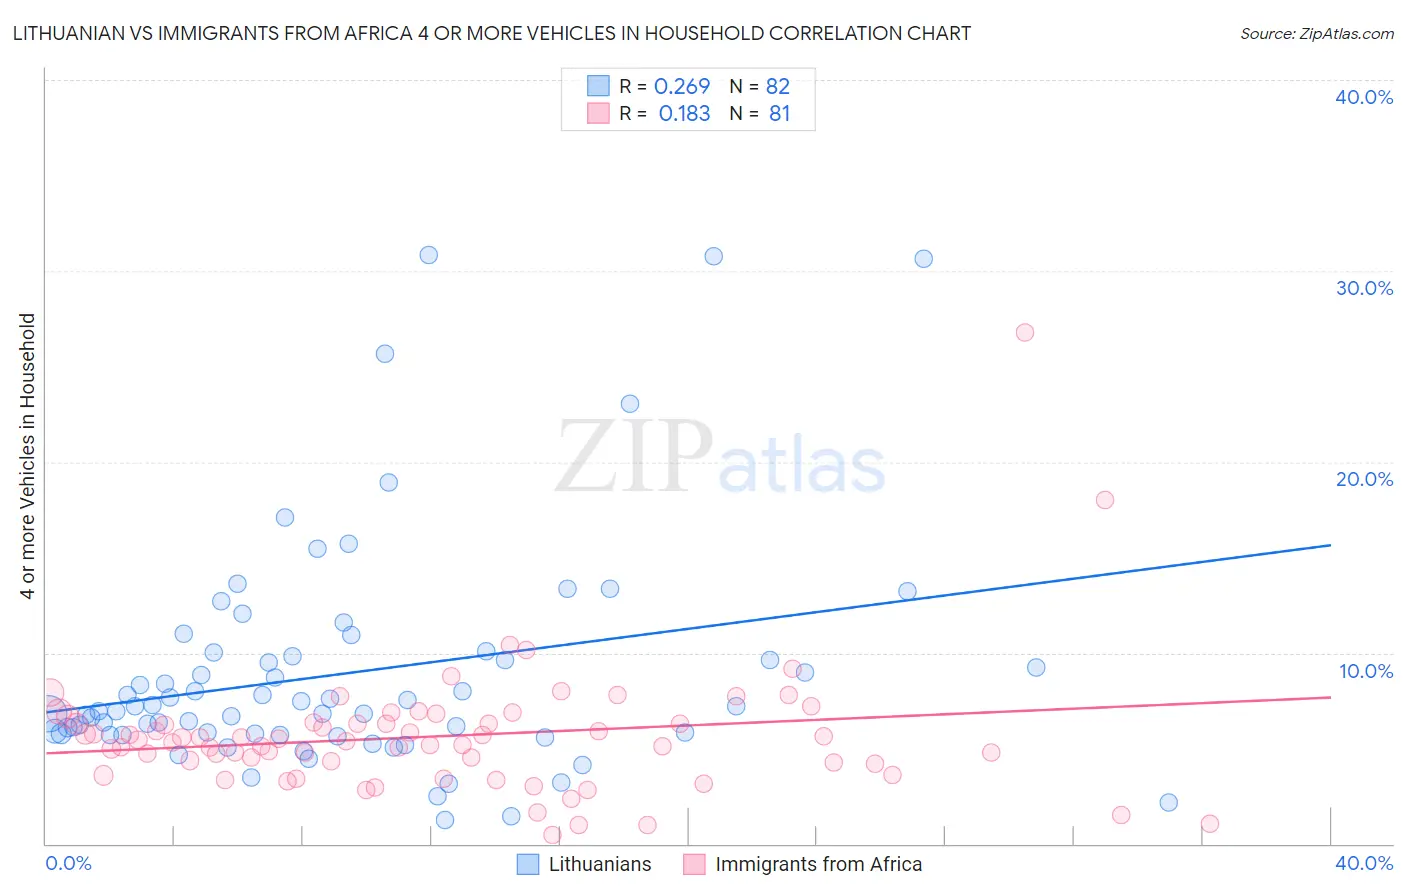
Lithuanian vs Immigrants from Africa 4 or more Vehicles in Household Correlation Chart
The statistical analysis conducted on geographies consisting of 420,091,012 people shows a weak positive correlation between the proportion of Lithuanians and percentage of households with 4 or more vehicles available in the United States with a correlation coefficient (R) of 0.269 and weighted average of 6.3%. Similarly, the statistical analysis conducted on geographies consisting of 466,853,730 people shows a poor positive correlation between the proportion of Immigrants from Africa and percentage of households with 4 or more vehicles available in the United States with a correlation coefficient (R) of 0.183 and weighted average of 5.6%, a difference of 13.3%.
4 or more Vehicles in Household Correlation Summary
| Measurement | Lithuanian | Immigrants from Africa |
| Minimum | 1.3% | 0.46% |
| Maximum | 30.8% | 26.8% |
| Range | 29.6% | 26.3% |
| Mean | 8.9% | 5.6% |
| Median | 7.1% | 5.4% |
| Interquartile 25% (IQ1) | 5.8% | 4.2% |
| Interquartile 75% (IQ3) | 9.8% | 6.3% |
| Interquartile Range (IQR) | 4.1% | 2.1% |
| Standard Deviation (Sample) | 6.0% | 3.4% |
| Standard Deviation (Population) | 6.0% | 3.4% |
Similar Demographics by 4 or more Vehicles in Household
Demographics Similar to Lithuanians by 4 or more Vehicles in Household
In terms of 4 or more vehicles in household, the demographic groups most similar to Lithuanians are Slovene (6.3%, a difference of 0.12%), Immigrants from Western Europe (6.3%, a difference of 0.12%), Immigrants from Lebanon (6.3%, a difference of 0.17%), Immigrants from India (6.3%, a difference of 0.20%), and Ukrainian (6.3%, a difference of 0.24%).
| Demographics | Rating | Rank | 4 or more Vehicles in Household |
| Poles | 56.9 /100 | #167 | Average 6.4% |
| Lebanese | 55.8 /100 | #168 | Average 6.4% |
| Estonians | 55.1 /100 | #169 | Average 6.4% |
| Immigrants | Syria | 52.8 /100 | #170 | Average 6.3% |
| Immigrants | India | 51.9 /100 | #171 | Average 6.3% |
| Immigrants | Lebanon | 51.7 /100 | #172 | Average 6.3% |
| Slovenes | 51.1 /100 | #173 | Average 6.3% |
| Lithuanians | 50.0 /100 | #174 | Average 6.3% |
| Immigrants | Western Europe | 48.8 /100 | #175 | Average 6.3% |
| Ukrainians | 47.6 /100 | #176 | Average 6.3% |
| Slovaks | 46.9 /100 | #177 | Average 6.3% |
| Belizeans | 44.5 /100 | #178 | Average 6.3% |
| Immigrants | Japan | 43.1 /100 | #179 | Average 6.3% |
| Syrians | 42.0 /100 | #180 | Average 6.3% |
| Yugoslavians | 41.1 /100 | #181 | Average 6.3% |
Demographics Similar to Immigrants from Africa by 4 or more Vehicles in Household
In terms of 4 or more vehicles in household, the demographic groups most similar to Immigrants from Africa are South American (5.6%, a difference of 0.22%), Immigrants from Nepal (5.6%, a difference of 0.24%), Immigrants from Ukraine (5.6%, a difference of 0.32%), Immigrants from Saudi Arabia (5.6%, a difference of 0.54%), and Bermudan (5.6%, a difference of 0.63%).
| Demographics | Rating | Rank | 4 or more Vehicles in Household |
| Immigrants | Northern Africa | 1.4 /100 | #257 | Tragic 5.6% |
| Immigrants | Lithuania | 1.4 /100 | #258 | Tragic 5.6% |
| Immigrants | France | 1.3 /100 | #259 | Tragic 5.6% |
| Uruguayans | 1.3 /100 | #260 | Tragic 5.6% |
| Sudanese | 1.2 /100 | #261 | Tragic 5.6% |
| Bermudans | 1.2 /100 | #262 | Tragic 5.6% |
| Immigrants | Saudi Arabia | 1.1 /100 | #263 | Tragic 5.6% |
| Immigrants | Africa | 1.0 /100 | #264 | Tragic 5.6% |
| South Americans | 0.9 /100 | #265 | Tragic 5.6% |
| Immigrants | Nepal | 0.9 /100 | #266 | Tragic 5.6% |
| Immigrants | Ukraine | 0.9 /100 | #267 | Tragic 5.6% |
| Colombians | 0.7 /100 | #268 | Tragic 5.5% |
| Carpatho Rusyns | 0.7 /100 | #269 | Tragic 5.5% |
| Okinawans | 0.6 /100 | #270 | Tragic 5.5% |
| Immigrants | Sudan | 0.6 /100 | #271 | Tragic 5.5% |