Slovak vs Welsh 2 or more Vehicles in Household

COMPARE

Slovak
Race
Ancestry
AfghanAfricanAlaska NativeAlaskan AthabascanAlbanianAleutAlsatianAmericanApacheArabArapahoArgentineanArmenianAssyrian/Chaldean/SyriacAustralianAustrianBahamianBangladeshiBarbadianBasqueBelgianBelizeanBermudanBhutaneseBlackfeetBolivianBrazilianBritishBritish West IndianBulgarianBurmeseCajunCambodianCanadianCape VerdeanCarpatho RusynCelticCentral AmericanCentral American IndianCherokeeCheyenneChickasawChileanChineseChippewaChoctawColombianColvilleComancheCosta RicanCreeCreekCroatianCrowCubanCypriotCzechCzechoslovakianDanishDelawareDominicanDutchDutch West IndianEastern EuropeanEcuadorianEgyptianEnglishEstonianEthiopianEuropeanFijianFilipinoFinnishFrenchFrench American IndianFrench CanadianGermanGerman RussianGhanaianGreekGuamanian/ChamorroGuatemalanGuyaneseHaitianHmongHonduranHopiHoumaHungarianIcelanderIndian (Asian)IndonesianInupiatIranianIraqiIrishIroquoisIsraeliItalianJamaicanJapaneseJordanianKenyanKiowaKoreanLaotianLatvianLebaneseLiberianLithuanianLumbeeLuxembourgerMacedonianMalaysianMalteseMarshalleseMenomineeMexicanMexican American IndianMongolianMoroccanNative HawaiianNavajoNepaleseNew ZealanderNicaraguanNigerianNorthern EuropeanNorwegianOkinawanOsageOttawaPaiutePakistaniPalestinianPanamanianParaguayanPennsylvania GermanPeruvianPimaPolishPortuguesePotawatomiPuebloPuerto RicanPuget Sound SalishRomanianRussianSalvadoranSamoanScandinavianScotch-IrishScottishSeminoleSenegaleseSerbianShoshoneSierra LeoneanSiouxSlavicSlovakSloveneSomaliSouth AfricanSouth AmericanSouth American IndianSoviet UnionSpaniardSpanishSpanish AmericanSpanish American IndianSri LankanSubsaharan AfricanSudaneseSwedishSwissSyrianTaiwaneseThaiTlingit-HaidaTohono O'OdhamTonganTrinidadian and TobagonianTsimshianTurkishU.S. Virgin IslanderUgandanUkrainianUruguayanUteVenezuelanVietnameseWest IndianYakamaYaquiYugoslavianYumanYup'ikZimbabwean
Immigration
NonimmigrantsImmigrantsAfghanistanAfricaAlbaniaArgentinaArmeniaAsiaAustraliaAustriaBahamasBangladeshBarbadosBelarusBelgiumBelizeBoliviaBosnia and HerzegovinaBrazilBulgariaBurma/MyanmarCabo VerdeCambodiaCameroonCanadaCaribbeanCentral AmericaChileChinaColombiaCongoCosta RicaCroatiaCubaCzechoslovakiaDenmarkDominicaDominican RepublicEastern AfricaEastern AsiaEastern EuropeEcuadorEgyptEl SalvadorEnglandEritreaEthiopiaEuropeFijiFranceGermanyGhanaGreeceGrenadaGuatemalaGuyanaHaitiHondurasHong KongHungaryIndiaIndonesiaIranIraqIrelandIsraelItalyJamaicaJapanJordanKazakhstanKenyaKoreaKuwaitLaosLatin AmericaLatviaLebanonLiberiaLithuaniaMalaysiaMexicoMicronesiaMiddle AfricaMoldovaMoroccoNepalNetherlandsNicaraguaNigeriaNorth AmericaNorth MacedoniaNorthern AfricaNorthern EuropeNorwayOceaniaPakistanPanamaPeruPhilippinesPolandPortugalRomaniaRussiaSaudi ArabiaScotlandSenegalSerbiaSierra LeoneSingaporeSomaliaSouth AfricaSouth AmericaSouth Central AsiaSouth Eastern AsiaSouthern EuropeSpainSri LankaSt. Vincent and the GrenadinesSudanSwedenSwitzerlandSyriaTaiwanThailandTrinidad and TobagoTurkeyUgandaUkraineUruguayUzbekistanVenezuelaVietnamWest IndiesWestern AfricaWestern AsiaWestern EuropeYemenZaireZimbabweAzores
Welsh
Race
Ancestry
AfghanAfricanAlaska NativeAlaskan AthabascanAlbanianAleutAlsatianAmericanApacheArabArapahoArgentineanArmenianAssyrian/Chaldean/SyriacAustralianAustrianBahamianBangladeshiBarbadianBasqueBelgianBelizeanBermudanBhutaneseBlackfeetBolivianBrazilianBritishBritish West IndianBulgarianBurmeseCajunCambodianCanadianCape VerdeanCarpatho RusynCelticCentral AmericanCentral American IndianCherokeeCheyenneChickasawChileanChineseChippewaChoctawColombianColvilleComancheCosta RicanCreeCreekCroatianCrowCubanCypriotCzechCzechoslovakianDanishDelawareDominicanDutchDutch West IndianEastern EuropeanEcuadorianEgyptianEnglishEstonianEthiopianEuropeanFijianFilipinoFinnishFrenchFrench American IndianFrench CanadianGermanGerman RussianGhanaianGreekGuamanian/ChamorroGuatemalanGuyaneseHaitianHmongHonduranHopiHoumaHungarianIcelanderIndian (Asian)IndonesianInupiatIranianIraqiIrishIroquoisIsraeliItalianJamaicanJapaneseJordanianKenyanKiowaKoreanLaotianLatvianLebaneseLiberianLithuanianLumbeeLuxembourgerMacedonianMalaysianMalteseMarshalleseMenomineeMexicanMexican American IndianMongolianMoroccanNative HawaiianNavajoNepaleseNew ZealanderNicaraguanNigerianNorthern EuropeanNorwegianOkinawanOsageOttawaPaiutePakistaniPalestinianPanamanianParaguayanPennsylvania GermanPeruvianPimaPolishPortuguesePotawatomiPuebloPuerto RicanPuget Sound SalishRomanianRussianSalvadoranSamoanScandinavianScotch-IrishScottishSeminoleSenegaleseSerbianShoshoneSierra LeoneanSiouxSlavicSloveneSomaliSouth AfricanSouth AmericanSouth American IndianSoviet UnionSpaniardSpanishSpanish AmericanSpanish American IndianSri LankanSubsaharan AfricanSudaneseSwedishSwissSyrianTaiwaneseThaiTlingit-HaidaTohono O'OdhamTonganTrinidadian and TobagonianTsimshianTurkishU.S. Virgin IslanderUgandanUkrainianUruguayanUteVenezuelanVietnameseWelshWest IndianYakamaYaquiYugoslavianYumanYup'ikZimbabwean
Immigration
NonimmigrantsImmigrantsAfghanistanAfricaAlbaniaArgentinaArmeniaAsiaAustraliaAustriaBahamasBangladeshBarbadosBelarusBelgiumBelizeBoliviaBosnia and HerzegovinaBrazilBulgariaBurma/MyanmarCabo VerdeCambodiaCameroonCanadaCaribbeanCentral AmericaChileChinaColombiaCongoCosta RicaCroatiaCubaCzechoslovakiaDenmarkDominicaDominican RepublicEastern AfricaEastern AsiaEastern EuropeEcuadorEgyptEl SalvadorEnglandEritreaEthiopiaEuropeFijiFranceGermanyGhanaGreeceGrenadaGuatemalaGuyanaHaitiHondurasHong KongHungaryIndiaIndonesiaIranIraqIrelandIsraelItalyJamaicaJapanJordanKazakhstanKenyaKoreaKuwaitLaosLatin AmericaLatviaLebanonLiberiaLithuaniaMalaysiaMexicoMicronesiaMiddle AfricaMoldovaMoroccoNepalNetherlandsNicaraguaNigeriaNorth AmericaNorth MacedoniaNorthern AfricaNorthern EuropeNorwayOceaniaPakistanPanamaPeruPhilippinesPolandPortugalRomaniaRussiaSaudi ArabiaScotlandSenegalSerbiaSierra LeoneSingaporeSomaliaSouth AfricaSouth AmericaSouth Central AsiaSouth Eastern AsiaSouthern EuropeSpainSri LankaSt. Vincent and the GrenadinesSudanSwedenSwitzerlandSyriaTaiwanThailandTrinidad and TobagoTurkeyUgandaUkraineUruguayUzbekistanVenezuelaVietnamWest IndiesWestern AfricaWestern AsiaWestern EuropeYemenZaireZimbabweAzores
2 or more Vehicles in Household
Income
Poverty
Unemployment
Labor Participation
Family Structure
Vehicle Availability
Education Level
Disability

2 or more Vehicles in Household Comparison

Slovaks

Welsh

Exceptional
Exceptional
58.0%
2 OR MORE VEHICLES IN HOUSEHOLD
99.2/ 100
METRIC RATING
85th/ 347
METRIC RANK
60.8%
2 OR MORE VEHICLES IN HOUSEHOLD
100.0/ 100
METRIC RATING
26th/ 347
METRIC RANK

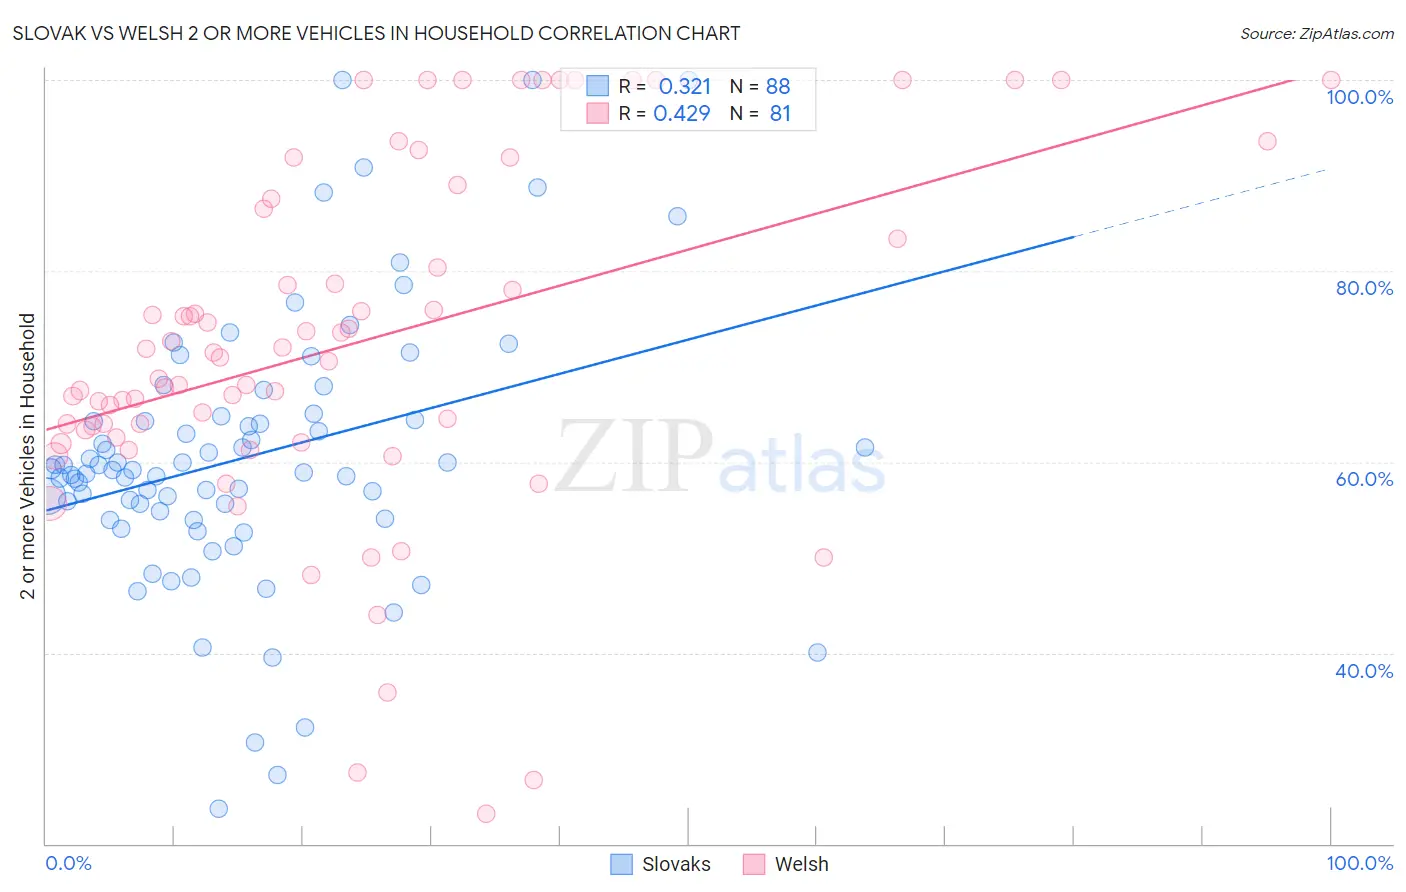
Slovak vs Welsh 2 or more Vehicles in Household Correlation Chart

The statistical analysis conducted on geographies consisting of 397,714,521 people shows a mild positive correlation between the proportion of Slovaks and percentage of households with 2 or more vehicles available in the United States with a correlation coefficient (R) of 0.321 and weighted average of 58.0%. Similarly, the statistical analysis conducted on geographies consisting of 528,240,215 people shows a moderate positive correlation between the proportion of Welsh and percentage of households with 2 or more vehicles available in the United States with a correlation coefficient (R) of 0.429 and weighted average of 60.8%, a difference of 4.9%.
Slovak vs Welsh 2 or more Vehicles in Household

2 or more Vehicles in Household Correlation Summary

MeasurementSlovakWelsh
Minimum23.6%23.1%
Maximum100.0%100.0%
Range76.4%76.9%
Mean60.5%72.5%
Median59.1%70.9%
Interquartile 25% (IQ1)54.5%62.9%
Interquartile 75% (IQ3)64.6%87.0%
Interquartile Range (IQR)10.1%24.1%
Standard Deviation (Sample)14.2%18.2%
Standard Deviation (Population)14.1%18.1%

Similar Demographics by 2 or more Vehicles in Household

Demographics Similar to Slovaks by 2 or more Vehicles in Household

In terms of 2 or more vehicles in household, the demographic groups most similar to Slovaks are Potawatomi (58.0%, a difference of 0.030%), Maltese (58.0%, a difference of 0.050%), Thai (57.9%, a difference of 0.070%), Icelander (58.0%, a difference of 0.080%), and Immigrants from Iran (57.9%, a difference of 0.080%).
DemographicsRating | Rank2 or more Vehicles in Household
Lithuanians
99.5
/100
|
#78
Exceptional
58.2%
Delaware
99.4
/100
|
#79
Exceptional
58.2%
Immigrants | England
99.3
/100
|
#80
Exceptional
58.1%
Immigrants | Iraq
99.3
/100
|
#81
Exceptional
58.1%
Iranians
99.3
/100
|
#82
Exceptional
58.1%
Icelanders
99.2
/100
|
#83
Exceptional
58.0%
Maltese
99.2
/100
|
#84
Exceptional
58.0%
Slovaks
99.2
/100
|
#85
Exceptional
58.0%
Potawatomi
99.1
/100
|
#86
Exceptional
58.0%
Thais
99.1
/100
|
#87
Exceptional
57.9%
Immigrants | Iran
99.1
/100
|
#88
Exceptional
57.9%
Immigrants | Germany
99.0
/100
|
#89
Exceptional
57.9%
Hispanics or Latinos
99.0
/100
|
#90
Exceptional
57.9%
Pakistanis
99.0
/100
|
#91
Exceptional
57.9%
Shoshone
99.0
/100
|
#92
Exceptional
57.9%

Demographics Similar to Welsh by 2 or more Vehicles in Household

In terms of 2 or more vehicles in household, the demographic groups most similar to Welsh are White/Caucasian (60.8%, a difference of 0.050%), Immigrants from Vietnam (60.9%, a difference of 0.20%), Scotch-Irish (60.9%, a difference of 0.24%), Swiss (61.0%, a difference of 0.28%), and Korean (61.0%, a difference of 0.31%).
DemographicsRating | Rank2 or more Vehicles in Household
Scottish
100.0
/100
|
#19
Exceptional
61.2%
Sri Lankans
100.0
/100
|
#20
Exceptional
61.0%
Koreans
100.0
/100
|
#21
Exceptional
61.0%
Swiss
100.0
/100
|
#22
Exceptional
61.0%
Scotch-Irish
100.0
/100
|
#23
Exceptional
60.9%
Immigrants | Vietnam
100.0
/100
|
#24
Exceptional
60.9%
Whites/Caucasians
100.0
/100
|
#25
Exceptional
60.8%
Welsh
100.0
/100
|
#26
Exceptional
60.8%
Assyrians/Chaldeans/Syriacs
100.0
/100
|
#27
Exceptional
60.5%
Guamanians/Chamorros
100.0
/100
|
#28
Exceptional
60.5%
Hawaiians
100.0
/100
|
#29
Exceptional
60.4%
Finns
100.0
/100
|
#30
Exceptional
60.3%
Spanish American Indians
100.0
/100
|
#31
Exceptional
60.3%
Arapaho
100.0
/100
|
#32
Exceptional
60.2%
Immigrants | Mexico
100.0
/100
|
#33
Exceptional
60.2%