Subsaharan African vs Swiss Single Mother Households
COMPARE
Subsaharan African
Swiss
Single Mother Households
Single Mother Households Comparison
Sub-Saharan Africans
Swiss
7.8%
SINGLE MOTHER HOUSEHOLDS
0.0/ 100
METRIC RATING
289th/ 347
METRIC RANK
5.6%
SINGLE MOTHER HOUSEHOLDS
98.1/ 100
METRIC RATING
78th/ 347
METRIC RANK
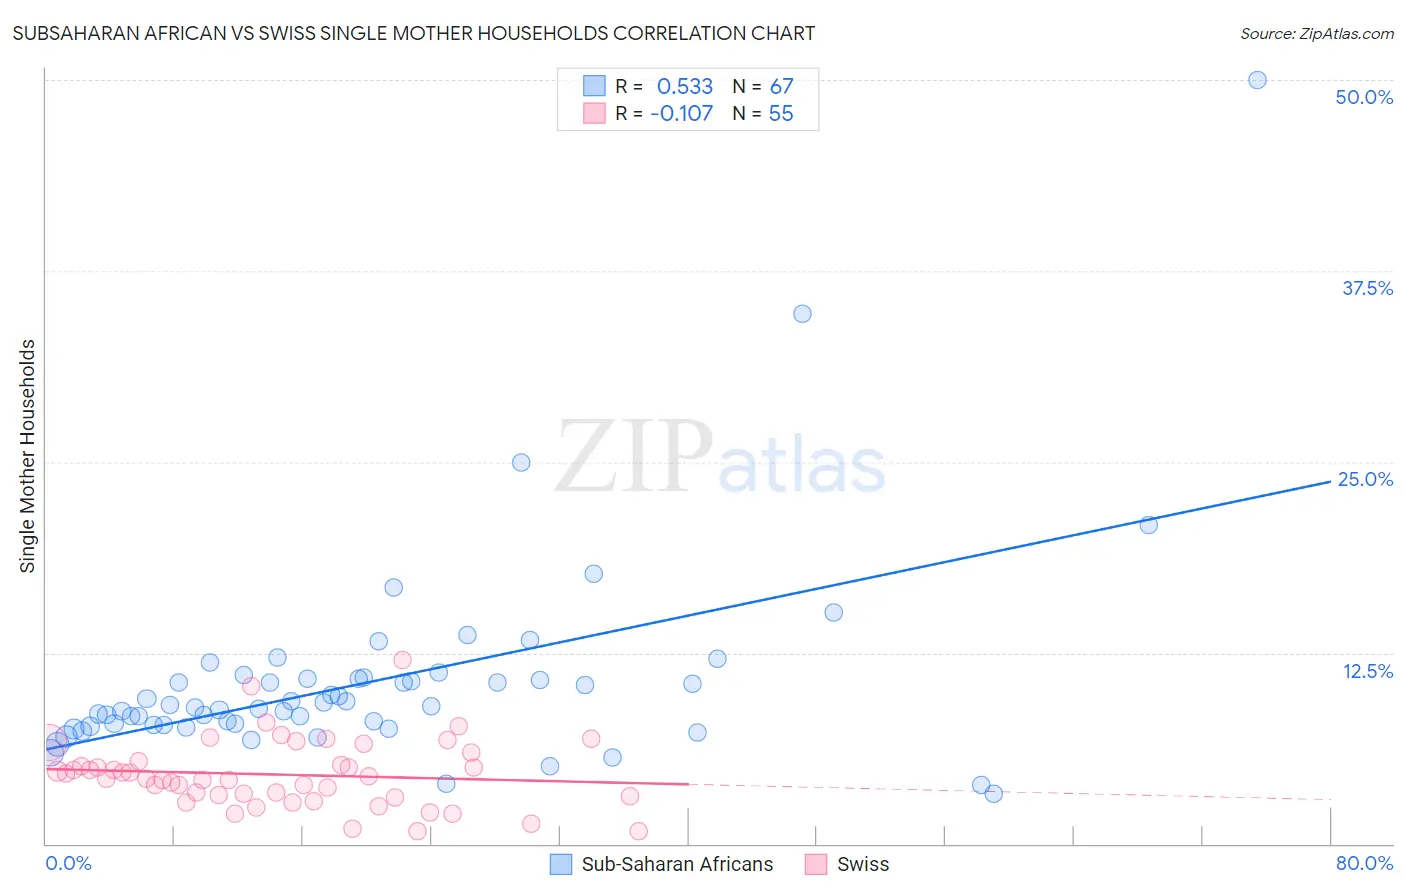
Subsaharan African vs Swiss Single Mother Households Correlation Chart
The statistical analysis conducted on geographies consisting of 505,994,563 people shows a substantial positive correlation between the proportion of Sub-Saharan Africans and percentage of single mother households in the United States with a correlation coefficient (R) of 0.533 and weighted average of 7.8%. Similarly, the statistical analysis conducted on geographies consisting of 462,653,045 people shows a poor negative correlation between the proportion of Swiss and percentage of single mother households in the United States with a correlation coefficient (R) of -0.107 and weighted average of 5.6%, a difference of 38.7%.
Single Mother Households Correlation Summary
| Measurement | Subsaharan African | Swiss |
| Minimum | 3.2% | 0.79% |
| Maximum | 50.0% | 12.0% |
| Range | 46.8% | 11.2% |
| Mean | 10.6% | 4.5% |
| Median | 9.0% | 4.3% |
| Interquartile 25% (IQ1) | 7.8% | 3.1% |
| Interquartile 75% (IQ3) | 10.8% | 5.4% |
| Interquartile Range (IQR) | 3.0% | 2.2% |
| Standard Deviation (Sample) | 6.8% | 2.2% |
| Standard Deviation (Population) | 6.7% | 2.2% |
Similar Demographics by Single Mother Households
Demographics Similar to Sub-Saharan Africans by Single Mother Households
In terms of single mother households, the demographic groups most similar to Sub-Saharan Africans are Immigrants from Nigeria (7.8%, a difference of 0.42%), West Indian (7.8%, a difference of 0.50%), Ghanaian (7.8%, a difference of 0.51%), Immigrants from Cameroon (7.9%, a difference of 0.87%), and Sierra Leonean (7.7%, a difference of 0.92%).
| Demographics | Rating | Rank | Single Mother Households |
| Guatemalans | 0.0 /100 | #282 | Tragic 7.7% |
| Nigerians | 0.0 /100 | #283 | Tragic 7.7% |
| Immigrants | Belize | 0.0 /100 | #284 | Tragic 7.7% |
| Trinidadians and Tobagonians | 0.0 /100 | #285 | Tragic 7.7% |
| Immigrants | Middle Africa | 0.0 /100 | #286 | Tragic 7.7% |
| Immigrants | Guatemala | 0.0 /100 | #287 | Tragic 7.7% |
| Sierra Leoneans | 0.0 /100 | #288 | Tragic 7.7% |
| Sub-Saharan Africans | 0.0 /100 | #289 | Tragic 7.8% |
| Immigrants | Nigeria | 0.0 /100 | #290 | Tragic 7.8% |
| West Indians | 0.0 /100 | #291 | Tragic 7.8% |
| Ghanaians | 0.0 /100 | #292 | Tragic 7.8% |
| Immigrants | Cameroon | 0.0 /100 | #293 | Tragic 7.9% |
| Apache | 0.0 /100 | #294 | Tragic 7.9% |
| Barbadians | 0.0 /100 | #295 | Tragic 7.9% |
| Immigrants | Latin America | 0.0 /100 | #296 | Tragic 7.9% |
Demographics Similar to Swiss by Single Mother Households
In terms of single mother households, the demographic groups most similar to Swiss are Romanian (5.6%, a difference of 0.0%), New Zealander (5.6%, a difference of 0.19%), Immigrants from Sri Lanka (5.6%, a difference of 0.20%), Slovene (5.6%, a difference of 0.26%), and Czech (5.6%, a difference of 0.31%).
| Demographics | Rating | Rank | Single Mother Households |
| Immigrants | Kazakhstan | 98.4 /100 | #71 | Exceptional 5.6% |
| Immigrants | Netherlands | 98.4 /100 | #72 | Exceptional 5.6% |
| Immigrants | Asia | 98.4 /100 | #73 | Exceptional 5.6% |
| Immigrants | North America | 98.3 /100 | #74 | Exceptional 5.6% |
| Slovenes | 98.3 /100 | #75 | Exceptional 5.6% |
| New Zealanders | 98.2 /100 | #76 | Exceptional 5.6% |
| Romanians | 98.1 /100 | #77 | Exceptional 5.6% |
| Swiss | 98.1 /100 | #78 | Exceptional 5.6% |
| Immigrants | Sri Lanka | 98.0 /100 | #79 | Exceptional 5.6% |
| Czechs | 97.9 /100 | #80 | Exceptional 5.6% |
| Immigrants | Moldova | 97.9 /100 | #81 | Exceptional 5.6% |
| Immigrants | Malaysia | 97.8 /100 | #82 | Exceptional 5.7% |
| Immigrants | Hungary | 97.8 /100 | #83 | Exceptional 5.7% |
| Carpatho Rusyns | 97.7 /100 | #84 | Exceptional 5.7% |
| Hungarians | 97.6 /100 | #85 | Exceptional 5.7% |