Subsaharan African vs Celtic In Labor Force | Age 35-44
COMPARE
Subsaharan African
Celtic
In Labor Force | Age 35-44
In Labor Force | Age 35-44 Comparison
Sub-Saharan Africans
Celtics
84.1%
IN LABOR FORCE | AGE 35-44
9.3/ 100
METRIC RATING
219th/ 347
METRIC RANK
83.8%
IN LABOR FORCE | AGE 35-44
1.4/ 100
METRIC RATING
239th/ 347
METRIC RANK
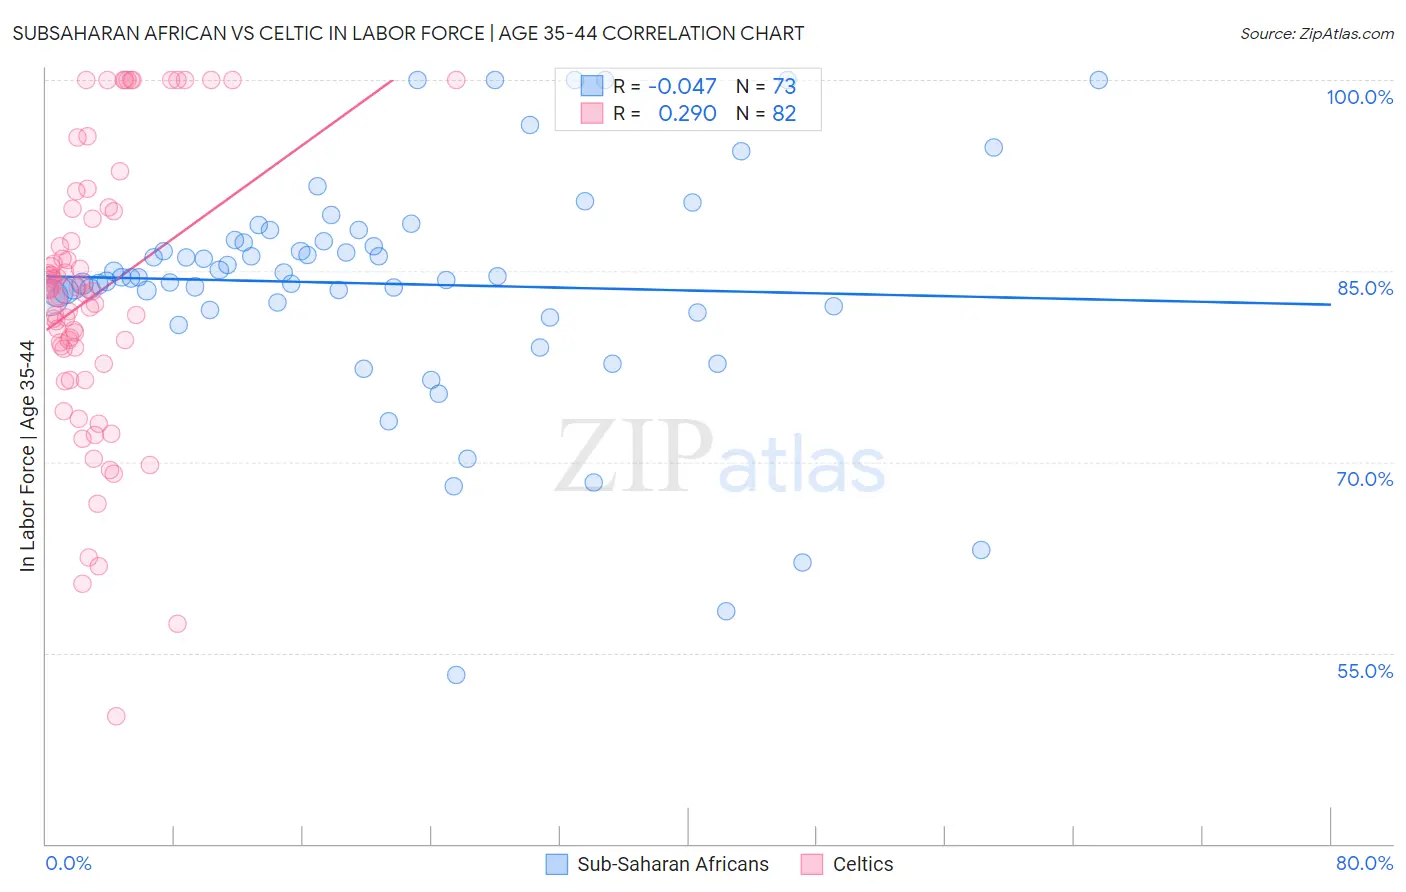
Subsaharan African vs Celtic In Labor Force | Age 35-44 Correlation Chart
The statistical analysis conducted on geographies consisting of 507,706,438 people shows no correlation between the proportion of Sub-Saharan Africans and labor force participation rate among population between the ages 35 and 44 in the United States with a correlation coefficient (R) of -0.047 and weighted average of 84.1%. Similarly, the statistical analysis conducted on geographies consisting of 168,864,991 people shows a weak positive correlation between the proportion of Celtics and labor force participation rate among population between the ages 35 and 44 in the United States with a correlation coefficient (R) of 0.290 and weighted average of 83.8%, a difference of 0.32%.
In Labor Force | Age 35-44 Correlation Summary
| Measurement | Subsaharan African | Celtic |
| Minimum | 53.3% | 50.0% |
| Maximum | 100.0% | 100.0% |
| Range | 46.7% | 50.0% |
| Mean | 84.0% | 83.1% |
| Median | 84.5% | 83.3% |
| Interquartile 25% (IQ1) | 82.1% | 78.9% |
| Interquartile 75% (IQ3) | 87.4% | 89.7% |
| Interquartile Range (IQR) | 5.3% | 10.9% |
| Standard Deviation (Sample) | 9.1% | 10.9% |
| Standard Deviation (Population) | 9.0% | 10.8% |
Demographics Similar to Sub-Saharan Africans and Celtics by In Labor Force | Age 35-44
In terms of in labor force | age 35-44, the demographic groups most similar to Sub-Saharan Africans are French (84.0%, a difference of 0.040%), Icelander (84.0%, a difference of 0.060%), Assyrian/Chaldean/Syriac (84.0%, a difference of 0.060%), Immigrants from Panama (84.0%, a difference of 0.070%), and U.S. Virgin Islander (84.0%, a difference of 0.070%). Similarly, the demographic groups most similar to Celtics are Immigrants from Laos (83.8%, a difference of 0.030%), English (83.8%, a difference of 0.050%), West Indian (83.9%, a difference of 0.090%), Immigrants from Syria (83.9%, a difference of 0.10%), and Immigrants from Oceania (83.9%, a difference of 0.11%).
| Demographics | Rating | Rank | In Labor Force | Age 35-44 |
| Sub-Saharan Africans | 9.3 /100 | #219 | Tragic 84.1% |
| French | 7.5 /100 | #220 | Tragic 84.0% |
| Icelanders | 6.7 /100 | #221 | Tragic 84.0% |
| Assyrians/Chaldeans/Syriacs | 6.6 /100 | #222 | Tragic 84.0% |
| Immigrants | Panama | 6.4 /100 | #223 | Tragic 84.0% |
| U.S. Virgin Islanders | 6.1 /100 | #224 | Tragic 84.0% |
| Immigrants | Burma/Myanmar | 6.1 /100 | #225 | Tragic 84.0% |
| Panamanians | 5.4 /100 | #226 | Tragic 84.0% |
| British West Indians | 5.3 /100 | #227 | Tragic 84.0% |
| Welsh | 5.3 /100 | #228 | Tragic 84.0% |
| Immigrants | Thailand | 4.7 /100 | #229 | Tragic 84.0% |
| Immigrants | Iraq | 3.7 /100 | #230 | Tragic 83.9% |
| Scottish | 3.2 /100 | #231 | Tragic 83.9% |
| Native Hawaiians | 3.0 /100 | #232 | Tragic 83.9% |
| Immigrants | Germany | 2.8 /100 | #233 | Tragic 83.9% |
| Immigrants | Oceania | 2.6 /100 | #234 | Tragic 83.9% |
| Immigrants | Syria | 2.5 /100 | #235 | Tragic 83.9% |
| West Indians | 2.4 /100 | #236 | Tragic 83.9% |
| English | 1.8 /100 | #237 | Tragic 83.8% |
| Immigrants | Laos | 1.7 /100 | #238 | Tragic 83.8% |
| Celtics | 1.4 /100 | #239 | Tragic 83.8% |