Subsaharan African vs Celtic Master's Degree
COMPARE
Subsaharan African
Celtic
Master's Degree
Master's Degree Comparison
Sub-Saharan Africans
Celtics
14.2%
MASTER'S DEGREE
19.4/ 100
METRIC RATING
210th/ 347
METRIC RANK
14.8%
MASTER'S DEGREE
41.3/ 100
METRIC RATING
180th/ 347
METRIC RANK
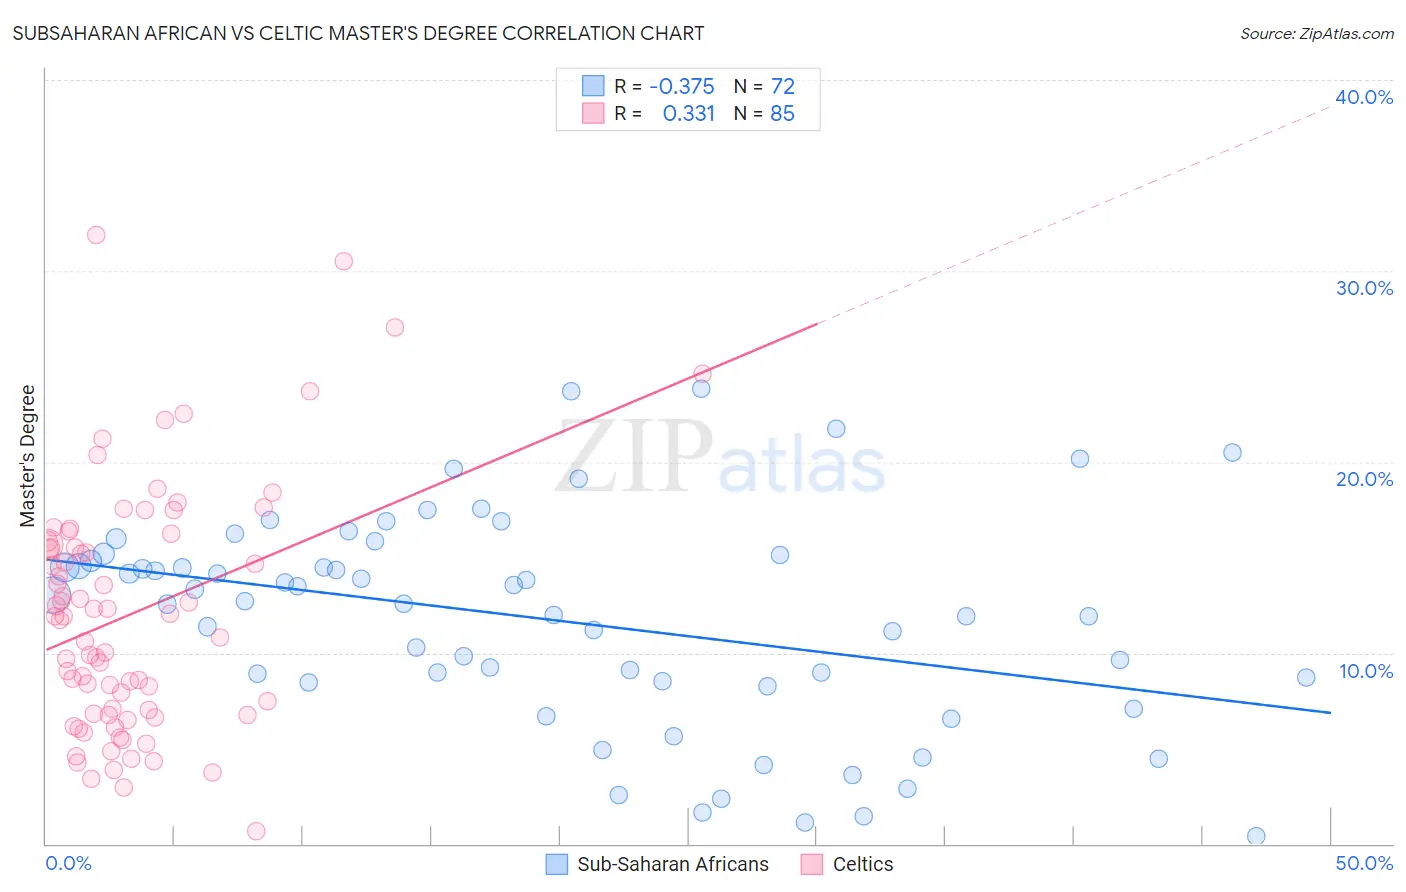
Subsaharan African vs Celtic Master's Degree Correlation Chart
The statistical analysis conducted on geographies consisting of 507,799,388 people shows a mild negative correlation between the proportion of Sub-Saharan Africans and percentage of population with at least master's degree education in the United States with a correlation coefficient (R) of -0.375 and weighted average of 14.2%. Similarly, the statistical analysis conducted on geographies consisting of 168,868,569 people shows a mild positive correlation between the proportion of Celtics and percentage of population with at least master's degree education in the United States with a correlation coefficient (R) of 0.331 and weighted average of 14.8%, a difference of 3.6%.
Master's Degree Correlation Summary
| Measurement | Subsaharan African | Celtic |
| Minimum | 0.40% | 0.67% |
| Maximum | 23.9% | 31.9% |
| Range | 23.5% | 31.2% |
| Mean | 11.7% | 12.0% |
| Median | 12.6% | 11.9% |
| Interquartile 25% (IQ1) | 8.5% | 6.8% |
| Interquartile 75% (IQ3) | 15.0% | 15.7% |
| Interquartile Range (IQR) | 6.5% | 9.0% |
| Standard Deviation (Sample) | 5.5% | 6.4% |
| Standard Deviation (Population) | 5.5% | 6.3% |
Similar Demographics by Master's Degree
Demographics Similar to Sub-Saharan Africans by Master's Degree
In terms of master's degree, the demographic groups most similar to Sub-Saharan Africans are Immigrants from Panama (14.3%, a difference of 0.13%), Immigrants from Barbados (14.3%, a difference of 0.22%), Somali (14.2%, a difference of 0.31%), Spanish (14.2%, a difference of 0.36%), and Immigrants from Bosnia and Herzegovina (14.3%, a difference of 0.52%).
| Demographics | Rating | Rank | Master's Degree |
| Yugoslavians | 24.3 /100 | #203 | Fair 14.4% |
| French | 23.7 /100 | #204 | Fair 14.4% |
| Trinidadians and Tobagonians | 23.5 /100 | #205 | Fair 14.4% |
| Scandinavians | 23.3 /100 | #206 | Fair 14.4% |
| Immigrants | Bosnia and Herzegovina | 22.0 /100 | #207 | Fair 14.3% |
| Immigrants | Barbados | 20.5 /100 | #208 | Fair 14.3% |
| Immigrants | Panama | 20.0 /100 | #209 | Fair 14.3% |
| Sub-Saharan Africans | 19.4 /100 | #210 | Poor 14.2% |
| Somalis | 18.0 /100 | #211 | Poor 14.2% |
| Spanish | 17.8 /100 | #212 | Poor 14.2% |
| Immigrants | Thailand | 17.0 /100 | #213 | Poor 14.2% |
| Finns | 16.9 /100 | #214 | Poor 14.2% |
| Immigrants | Vietnam | 16.1 /100 | #215 | Poor 14.1% |
| Immigrants | Somalia | 15.8 /100 | #216 | Poor 14.1% |
| Immigrants | Trinidad and Tobago | 15.8 /100 | #217 | Poor 14.1% |
Demographics Similar to Celtics by Master's Degree
In terms of master's degree, the demographic groups most similar to Celtics are Immigrants from Iraq (14.8%, a difference of 0.010%), Swiss (14.7%, a difference of 0.020%), Czech (14.7%, a difference of 0.12%), Sri Lankan (14.7%, a difference of 0.22%), and Immigrants from Zaire (14.7%, a difference of 0.25%).
| Demographics | Rating | Rank | Master's Degree |
| Costa Ricans | 52.5 /100 | #173 | Average 15.0% |
| Slovaks | 50.0 /100 | #174 | Average 14.9% |
| Immigrants | Peru | 49.6 /100 | #175 | Average 14.9% |
| Nigerians | 48.6 /100 | #176 | Average 14.9% |
| Immigrants | Colombia | 48.3 /100 | #177 | Average 14.9% |
| English | 45.0 /100 | #178 | Average 14.8% |
| Immigrants | Iraq | 41.3 /100 | #179 | Average 14.8% |
| Celtics | 41.3 /100 | #180 | Average 14.8% |
| Swiss | 41.1 /100 | #181 | Average 14.7% |
| Czechs | 40.4 /100 | #182 | Average 14.7% |
| Sri Lankans | 39.6 /100 | #183 | Fair 14.7% |
| Immigrants | Zaire | 39.5 /100 | #184 | Fair 14.7% |
| Barbadians | 38.3 /100 | #185 | Fair 14.7% |
| Immigrants | Oceania | 37.1 /100 | #186 | Fair 14.7% |
| Basques | 36.5 /100 | #187 | Fair 14.7% |