Sri Lankan vs Immigrants from West Indies 4 or more Vehicles in Household
COMPARE
Sri Lankan
Immigrants from West Indies
4 or more Vehicles in Household
4 or more Vehicles in Household Comparison
Sri Lankans
Immigrants from West Indies
8.4%
4 OR MORE VEHICLES IN HOUSEHOLD
100.0/ 100
METRIC RATING
27th/ 347
METRIC RANK
4.7%
4 OR MORE VEHICLES IN HOUSEHOLD
0.0/ 100
METRIC RATING
314th/ 347
METRIC RANK
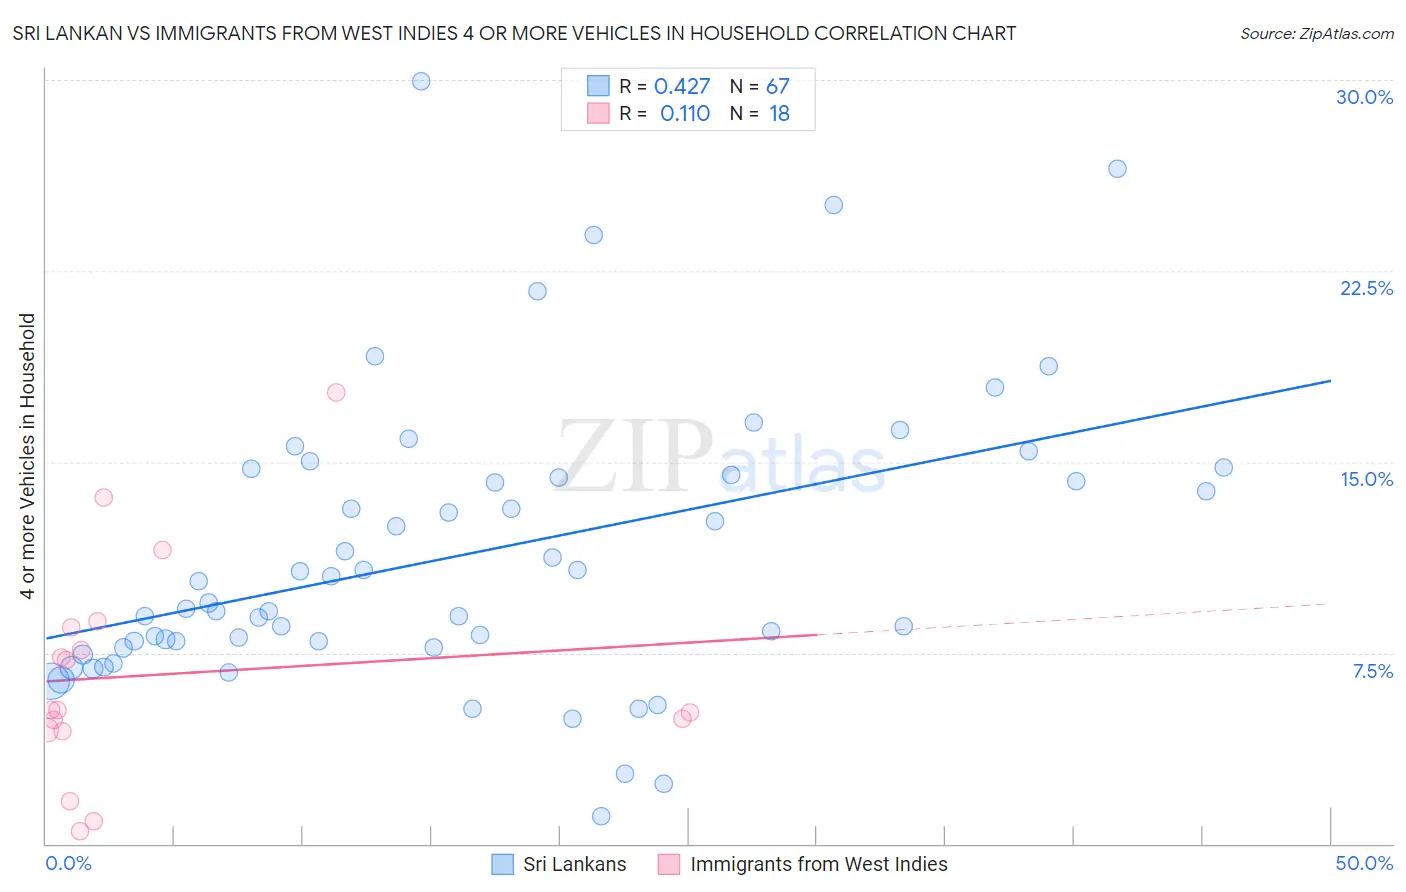
Sri Lankan vs Immigrants from West Indies 4 or more Vehicles in Household Correlation Chart
The statistical analysis conducted on geographies consisting of 438,304,250 people shows a moderate positive correlation between the proportion of Sri Lankans and percentage of households with 4 or more vehicles available in the United States with a correlation coefficient (R) of 0.427 and weighted average of 8.4%. Similarly, the statistical analysis conducted on geographies consisting of 72,052,209 people shows a poor positive correlation between the proportion of Immigrants from West Indies and percentage of households with 4 or more vehicles available in the United States with a correlation coefficient (R) of 0.110 and weighted average of 4.7%, a difference of 76.9%.
4 or more Vehicles in Household Correlation Summary
| Measurement | Sri Lankan | Immigrants from West Indies |
| Minimum | 1.1% | 0.50% |
| Maximum | 30.0% | 17.7% |
| Range | 28.9% | 17.2% |
| Mean | 11.4% | 6.6% |
| Median | 9.5% | 5.3% |
| Interquartile 25% (IQ1) | 7.7% | 4.5% |
| Interquartile 75% (IQ3) | 14.5% | 8.5% |
| Interquartile Range (IQR) | 6.8% | 4.0% |
| Standard Deviation (Sample) | 5.7% | 4.4% |
| Standard Deviation (Population) | 5.6% | 4.2% |
Similar Demographics by 4 or more Vehicles in Household
Demographics Similar to Sri Lankans by 4 or more Vehicles in Household
In terms of 4 or more vehicles in household, the demographic groups most similar to Sri Lankans are Mexican American Indian (8.4%, a difference of 0.12%), Basque (8.4%, a difference of 0.43%), Immigrants from Central America (8.5%, a difference of 0.98%), Cheyenne (8.3%, a difference of 1.4%), and Immigrants from Philippines (8.5%, a difference of 1.8%).
| Demographics | Rating | Rank | 4 or more Vehicles in Household |
| Pueblo | 100.0 /100 | #20 | Exceptional 8.6% |
| Danes | 100.0 /100 | #21 | Exceptional 8.6% |
| Immigrants | Vietnam | 100.0 /100 | #22 | Exceptional 8.6% |
| Immigrants | Philippines | 100.0 /100 | #23 | Exceptional 8.5% |
| Immigrants | Central America | 100.0 /100 | #24 | Exceptional 8.5% |
| Basques | 100.0 /100 | #25 | Exceptional 8.4% |
| Mexican American Indians | 100.0 /100 | #26 | Exceptional 8.4% |
| Sri Lankans | 100.0 /100 | #27 | Exceptional 8.4% |
| Cheyenne | 100.0 /100 | #28 | Exceptional 8.3% |
| Immigrants | South Eastern Asia | 100.0 /100 | #29 | Exceptional 8.2% |
| Navajo | 100.0 /100 | #30 | Exceptional 8.2% |
| Natives/Alaskans | 100.0 /100 | #31 | Exceptional 8.2% |
| Marshallese | 100.0 /100 | #32 | Exceptional 8.1% |
| Yaqui | 100.0 /100 | #33 | Exceptional 8.1% |
| Alaskan Athabascans | 100.0 /100 | #34 | Exceptional 8.1% |
Demographics Similar to Immigrants from West Indies by 4 or more Vehicles in Household
In terms of 4 or more vehicles in household, the demographic groups most similar to Immigrants from West Indies are Immigrants from Belarus (4.7%, a difference of 0.090%), Puerto Rican (4.7%, a difference of 0.53%), Immigrants from Israel (4.8%, a difference of 0.79%), Albanian (4.8%, a difference of 0.81%), and U.S. Virgin Islander (4.6%, a difference of 2.2%).
| Demographics | Rating | Rank | 4 or more Vehicles in Household |
| Menominee | 0.0 /100 | #307 | Tragic 5.0% |
| Paraguayans | 0.0 /100 | #308 | Tragic 4.9% |
| Immigrants | Somalia | 0.0 /100 | #309 | Tragic 4.9% |
| Moroccans | 0.0 /100 | #310 | Tragic 4.9% |
| Houma | 0.0 /100 | #311 | Tragic 4.9% |
| Albanians | 0.0 /100 | #312 | Tragic 4.8% |
| Immigrants | Israel | 0.0 /100 | #313 | Tragic 4.8% |
| Immigrants | West Indies | 0.0 /100 | #314 | Tragic 4.7% |
| Immigrants | Belarus | 0.0 /100 | #315 | Tragic 4.7% |
| Puerto Ricans | 0.0 /100 | #316 | Tragic 4.7% |
| U.S. Virgin Islanders | 0.0 /100 | #317 | Tragic 4.6% |
| Jamaicans | 0.0 /100 | #318 | Tragic 4.6% |
| Haitians | 0.0 /100 | #319 | Tragic 4.6% |
| Immigrants | Haiti | 0.0 /100 | #320 | Tragic 4.5% |
| Ecuadorians | 0.0 /100 | #321 | Tragic 4.5% |