Immigrants from Netherlands vs Immigrants from West Indies 4 or more Vehicles in Household
COMPARE
Immigrants from Netherlands
Immigrants from West Indies
4 or more Vehicles in Household
4 or more Vehicles in Household Comparison
Immigrants from Netherlands
Immigrants from West Indies
6.6%
4 OR MORE VEHICLES IN HOUSEHOLD
87.8/ 100
METRIC RATING
132nd/ 347
METRIC RANK
4.7%
4 OR MORE VEHICLES IN HOUSEHOLD
0.0/ 100
METRIC RATING
314th/ 347
METRIC RANK
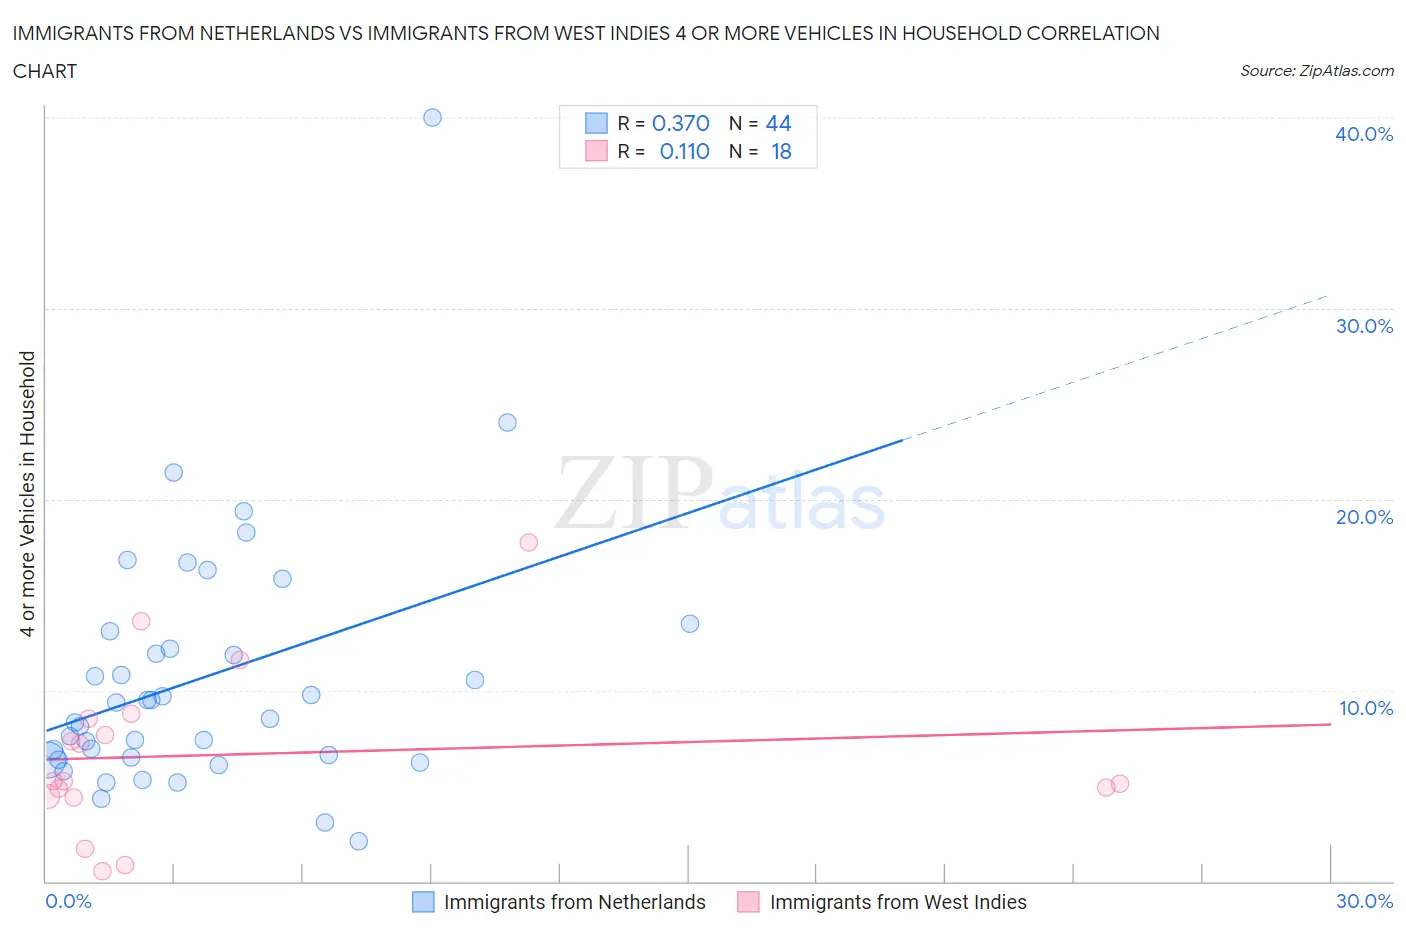
Immigrants from Netherlands vs Immigrants from West Indies 4 or more Vehicles in Household Correlation Chart
The statistical analysis conducted on geographies consisting of 237,226,549 people shows a mild positive correlation between the proportion of Immigrants from Netherlands and percentage of households with 4 or more vehicles available in the United States with a correlation coefficient (R) of 0.370 and weighted average of 6.6%. Similarly, the statistical analysis conducted on geographies consisting of 72,052,209 people shows a poor positive correlation between the proportion of Immigrants from West Indies and percentage of households with 4 or more vehicles available in the United States with a correlation coefficient (R) of 0.110 and weighted average of 4.7%, a difference of 40.0%.
4 or more Vehicles in Household Correlation Summary
| Measurement | Immigrants from Netherlands | Immigrants from West Indies |
| Minimum | 2.1% | 0.50% |
| Maximum | 40.0% | 17.7% |
| Range | 37.9% | 17.2% |
| Mean | 10.6% | 6.6% |
| Median | 8.9% | 5.3% |
| Interquartile 25% (IQ1) | 6.4% | 4.5% |
| Interquartile 75% (IQ3) | 12.6% | 8.5% |
| Interquartile Range (IQR) | 6.2% | 4.0% |
| Standard Deviation (Sample) | 6.7% | 4.4% |
| Standard Deviation (Population) | 6.6% | 4.2% |
Similar Demographics by 4 or more Vehicles in Household
Demographics Similar to Immigrants from Netherlands by 4 or more Vehicles in Household
In terms of 4 or more vehicles in household, the demographic groups most similar to Immigrants from Netherlands are Maltese (6.7%, a difference of 0.14%), Armenian (6.6%, a difference of 0.19%), Ottawa (6.6%, a difference of 0.21%), Tohono O'odham (6.6%, a difference of 0.24%), and Immigrants from Scotland (6.7%, a difference of 0.29%).
| Demographics | Rating | Rank | 4 or more Vehicles in Household |
| Austrians | 94.1 /100 | #125 | Exceptional 6.8% |
| Belgians | 94.1 /100 | #126 | Exceptional 6.8% |
| Immigrants | Korea | 93.8 /100 | #127 | Exceptional 6.8% |
| Immigrants | Bolivia | 92.5 /100 | #128 | Exceptional 6.7% |
| Immigrants | England | 92.0 /100 | #129 | Exceptional 6.7% |
| Immigrants | Scotland | 89.0 /100 | #130 | Excellent 6.7% |
| Maltese | 88.4 /100 | #131 | Excellent 6.7% |
| Immigrants | Netherlands | 87.8 /100 | #132 | Excellent 6.6% |
| Armenians | 86.9 /100 | #133 | Excellent 6.6% |
| Ottawa | 86.9 /100 | #134 | Excellent 6.6% |
| Tohono O'odham | 86.7 /100 | #135 | Excellent 6.6% |
| Luxembourgers | 86.4 /100 | #136 | Excellent 6.6% |
| French Canadians | 85.4 /100 | #137 | Excellent 6.6% |
| Italians | 84.5 /100 | #138 | Excellent 6.6% |
| Jordanians | 82.1 /100 | #139 | Excellent 6.6% |
Demographics Similar to Immigrants from West Indies by 4 or more Vehicles in Household
In terms of 4 or more vehicles in household, the demographic groups most similar to Immigrants from West Indies are Immigrants from Belarus (4.7%, a difference of 0.090%), Puerto Rican (4.7%, a difference of 0.53%), Immigrants from Israel (4.8%, a difference of 0.79%), Albanian (4.8%, a difference of 0.81%), and U.S. Virgin Islander (4.6%, a difference of 2.2%).
| Demographics | Rating | Rank | 4 or more Vehicles in Household |
| Menominee | 0.0 /100 | #307 | Tragic 5.0% |
| Paraguayans | 0.0 /100 | #308 | Tragic 4.9% |
| Immigrants | Somalia | 0.0 /100 | #309 | Tragic 4.9% |
| Moroccans | 0.0 /100 | #310 | Tragic 4.9% |
| Houma | 0.0 /100 | #311 | Tragic 4.9% |
| Albanians | 0.0 /100 | #312 | Tragic 4.8% |
| Immigrants | Israel | 0.0 /100 | #313 | Tragic 4.8% |
| Immigrants | West Indies | 0.0 /100 | #314 | Tragic 4.7% |
| Immigrants | Belarus | 0.0 /100 | #315 | Tragic 4.7% |
| Puerto Ricans | 0.0 /100 | #316 | Tragic 4.7% |
| U.S. Virgin Islanders | 0.0 /100 | #317 | Tragic 4.6% |
| Jamaicans | 0.0 /100 | #318 | Tragic 4.6% |
| Haitians | 0.0 /100 | #319 | Tragic 4.6% |
| Immigrants | Haiti | 0.0 /100 | #320 | Tragic 4.5% |
| Ecuadorians | 0.0 /100 | #321 | Tragic 4.5% |