Sri Lankan vs Immigrants from West Indies 1 or more Vehicles in Household
COMPARE
Sri Lankan
Immigrants from West Indies
1 or more Vehicles in Household
1 or more Vehicles in Household Comparison
Sri Lankans
Immigrants from West Indies
92.5%
1 OR MORE VEHICLES IN HOUSEHOLD
100.0/ 100
METRIC RATING
28th/ 347
METRIC RANK
79.5%
1 OR MORE VEHICLES IN HOUSEHOLD
0.0/ 100
METRIC RATING
326th/ 347
METRIC RANK
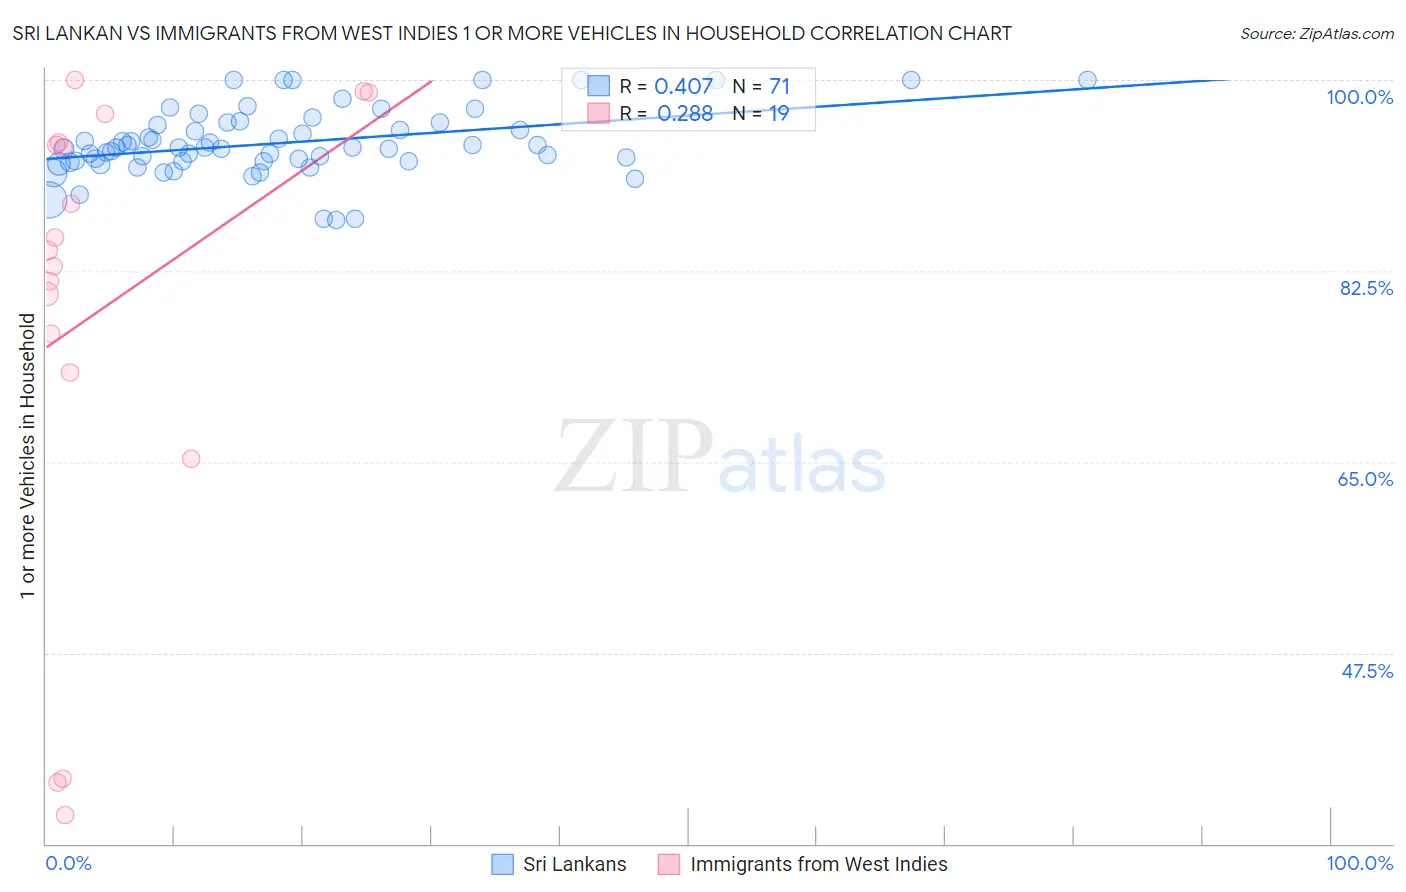
Sri Lankan vs Immigrants from West Indies 1 or more Vehicles in Household Correlation Chart
The statistical analysis conducted on geographies consisting of 440,171,076 people shows a moderate positive correlation between the proportion of Sri Lankans and percentage of households with 1 or more vehicles available in the United States with a correlation coefficient (R) of 0.407 and weighted average of 92.5%. Similarly, the statistical analysis conducted on geographies consisting of 72,454,628 people shows a weak positive correlation between the proportion of Immigrants from West Indies and percentage of households with 1 or more vehicles available in the United States with a correlation coefficient (R) of 0.288 and weighted average of 79.5%, a difference of 16.3%.
1 or more Vehicles in Household Correlation Summary
| Measurement | Sri Lankan | Immigrants from West Indies |
| Minimum | 87.2% | 32.7% |
| Maximum | 100.0% | 100.0% |
| Range | 12.8% | 67.3% |
| Mean | 94.2% | 78.9% |
| Median | 93.8% | 84.4% |
| Interquartile 25% (IQ1) | 92.6% | 73.2% |
| Interquartile 75% (IQ3) | 96.1% | 94.3% |
| Interquartile Range (IQR) | 3.5% | 21.1% |
| Standard Deviation (Sample) | 3.0% | 21.8% |
| Standard Deviation (Population) | 3.0% | 21.2% |
Similar Demographics by 1 or more Vehicles in Household
Demographics Similar to Sri Lankans by 1 or more Vehicles in Household
In terms of 1 or more vehicles in household, the demographic groups most similar to Sri Lankans are Native Hawaiian (92.4%, a difference of 0.010%), Finnish (92.4%, a difference of 0.020%), American (92.5%, a difference of 0.030%), Samoan (92.4%, a difference of 0.030%), and Basque (92.4%, a difference of 0.070%).
| Demographics | Rating | Rank | 1 or more Vehicles in Household |
| Ottawa | 100.0 /100 | #21 | Exceptional 92.7% |
| French | 100.0 /100 | #22 | Exceptional 92.7% |
| Nepalese | 100.0 /100 | #23 | Exceptional 92.6% |
| Yaqui | 100.0 /100 | #24 | Exceptional 92.6% |
| Immigrants | Iraq | 100.0 /100 | #25 | Exceptional 92.5% |
| British | 100.0 /100 | #26 | Exceptional 92.5% |
| Americans | 100.0 /100 | #27 | Exceptional 92.5% |
| Sri Lankans | 100.0 /100 | #28 | Exceptional 92.5% |
| Native Hawaiians | 100.0 /100 | #29 | Exceptional 92.4% |
| Finns | 100.0 /100 | #30 | Exceptional 92.4% |
| Samoans | 100.0 /100 | #31 | Exceptional 92.4% |
| Basques | 100.0 /100 | #32 | Exceptional 92.4% |
| Cherokee | 100.0 /100 | #33 | Exceptional 92.4% |
| Italians | 99.9 /100 | #34 | Exceptional 92.3% |
| Czechoslovakians | 99.9 /100 | #35 | Exceptional 92.3% |
Demographics Similar to Immigrants from West Indies by 1 or more Vehicles in Household
In terms of 1 or more vehicles in household, the demographic groups most similar to Immigrants from West Indies are Immigrants from Senegal (79.0%, a difference of 0.63%), Senegalese (80.4%, a difference of 1.1%), Immigrants from Caribbean (80.4%, a difference of 1.2%), Immigrants from Yemen (80.5%, a difference of 1.3%), and Ecuadorian (77.9%, a difference of 2.0%).
| Demographics | Rating | Rank | 1 or more Vehicles in Household |
| Immigrants | Belarus | 0.0 /100 | #319 | Tragic 83.3% |
| Soviet Union | 0.0 /100 | #320 | Tragic 82.7% |
| Jamaicans | 0.0 /100 | #321 | Tragic 82.1% |
| Immigrants | Cabo Verde | 0.0 /100 | #322 | Tragic 81.6% |
| Immigrants | Yemen | 0.0 /100 | #323 | Tragic 80.5% |
| Immigrants | Caribbean | 0.0 /100 | #324 | Tragic 80.4% |
| Senegalese | 0.0 /100 | #325 | Tragic 80.4% |
| Immigrants | West Indies | 0.0 /100 | #326 | Tragic 79.5% |
| Immigrants | Senegal | 0.0 /100 | #327 | Tragic 79.0% |
| Ecuadorians | 0.0 /100 | #328 | Tragic 77.9% |
| Immigrants | Dominica | 0.0 /100 | #329 | Tragic 77.8% |
| Immigrants | Trinidad and Tobago | 0.0 /100 | #330 | Tragic 76.8% |
| West Indians | 0.0 /100 | #331 | Tragic 76.4% |
| Trinidadians and Tobagonians | 0.0 /100 | #332 | Tragic 76.3% |
| Immigrants | Ecuador | 0.0 /100 | #333 | Tragic 76.2% |