Brazilian vs Immigrants from West Indies 4 or more Vehicles in Household
COMPARE
Brazilian
Immigrants from West Indies
4 or more Vehicles in Household
4 or more Vehicles in Household Comparison
Brazilians
Immigrants from West Indies
5.4%
4 OR MORE VEHICLES IN HOUSEHOLD
0.3/ 100
METRIC RATING
284th/ 347
METRIC RANK
4.7%
4 OR MORE VEHICLES IN HOUSEHOLD
0.0/ 100
METRIC RATING
314th/ 347
METRIC RANK
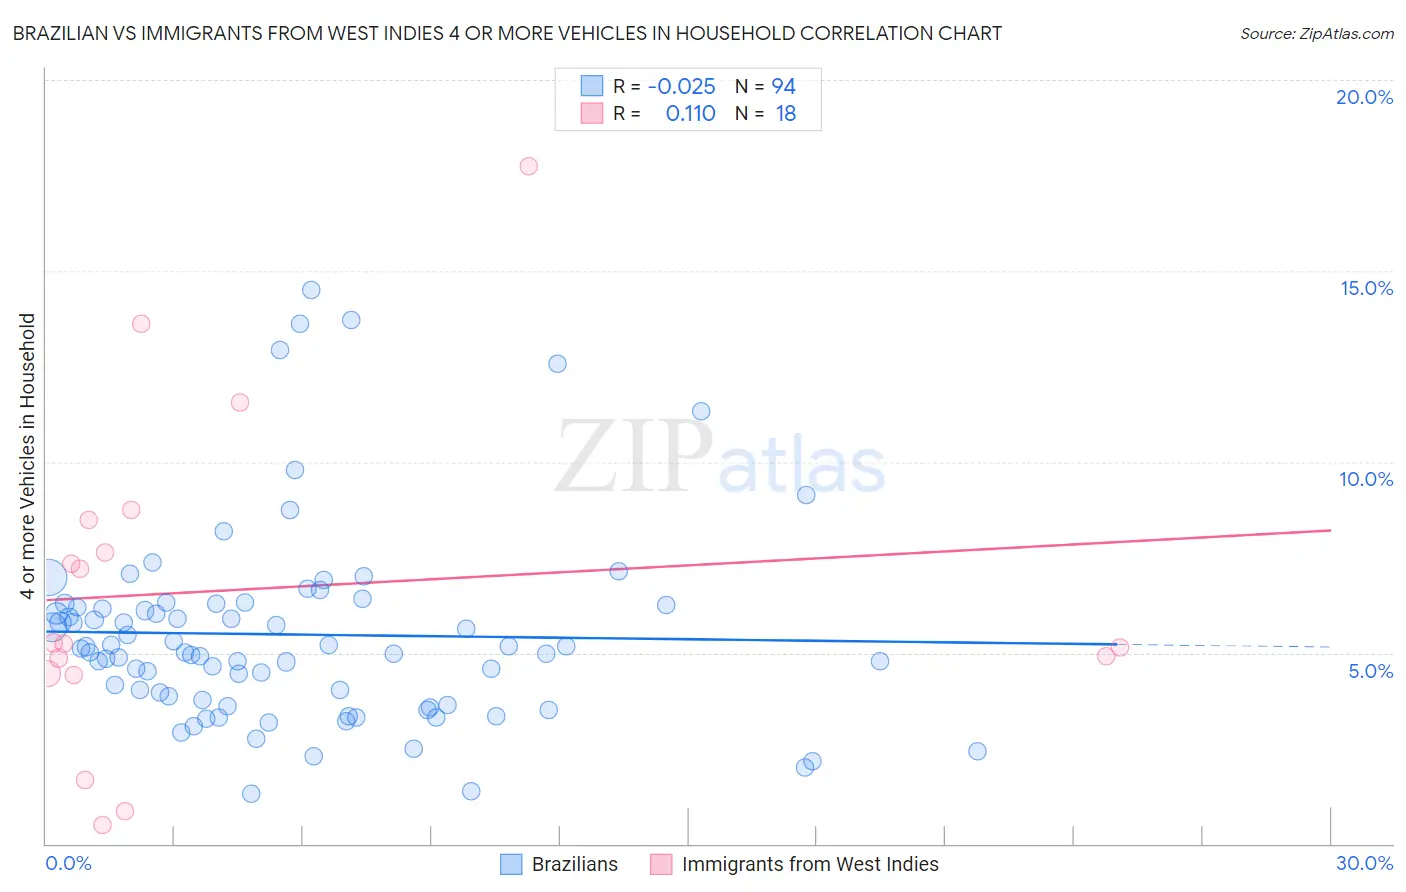
Brazilian vs Immigrants from West Indies 4 or more Vehicles in Household Correlation Chart
The statistical analysis conducted on geographies consisting of 322,327,740 people shows no correlation between the proportion of Brazilians and percentage of households with 4 or more vehicles available in the United States with a correlation coefficient (R) of -0.025 and weighted average of 5.4%. Similarly, the statistical analysis conducted on geographies consisting of 72,052,209 people shows a poor positive correlation between the proportion of Immigrants from West Indies and percentage of households with 4 or more vehicles available in the United States with a correlation coefficient (R) of 0.110 and weighted average of 4.7%, a difference of 13.3%.
4 or more Vehicles in Household Correlation Summary
| Measurement | Brazilian | Immigrants from West Indies |
| Minimum | 1.3% | 0.50% |
| Maximum | 14.5% | 17.7% |
| Range | 13.2% | 17.2% |
| Mean | 5.5% | 6.6% |
| Median | 5.1% | 5.3% |
| Interquartile 25% (IQ1) | 3.7% | 4.5% |
| Interquartile 75% (IQ3) | 6.3% | 8.5% |
| Interquartile Range (IQR) | 2.5% | 4.0% |
| Standard Deviation (Sample) | 2.6% | 4.4% |
| Standard Deviation (Population) | 2.6% | 4.2% |
Similar Demographics by 4 or more Vehicles in Household
Demographics Similar to Brazilians by 4 or more Vehicles in Household
In terms of 4 or more vehicles in household, the demographic groups most similar to Brazilians are Immigrants from Ireland (5.4%, a difference of 0.29%), Immigrants from Liberia (5.4%, a difference of 0.34%), Immigrants from Spain (5.4%, a difference of 0.37%), Immigrants from Colombia (5.4%, a difference of 0.38%), and Immigrants from Croatia (5.4%, a difference of 0.47%).
| Demographics | Rating | Rank | 4 or more Vehicles in Household |
| Immigrants | Bulgaria | 0.5 /100 | #277 | Tragic 5.5% |
| Immigrants | Eastern Europe | 0.4 /100 | #278 | Tragic 5.4% |
| Immigrants | Uruguay | 0.3 /100 | #279 | Tragic 5.4% |
| Alsatians | 0.3 /100 | #280 | Tragic 5.4% |
| Immigrants | Western Africa | 0.3 /100 | #281 | Tragic 5.4% |
| Immigrants | Spain | 0.3 /100 | #282 | Tragic 5.4% |
| Immigrants | Ireland | 0.3 /100 | #283 | Tragic 5.4% |
| Brazilians | 0.3 /100 | #284 | Tragic 5.4% |
| Immigrants | Liberia | 0.2 /100 | #285 | Tragic 5.4% |
| Immigrants | Colombia | 0.2 /100 | #286 | Tragic 5.4% |
| Immigrants | Croatia | 0.2 /100 | #287 | Tragic 5.4% |
| Venezuelans | 0.2 /100 | #288 | Tragic 5.3% |
| Immigrants | Bosnia and Herzegovina | 0.2 /100 | #289 | Tragic 5.3% |
| Immigrants | Russia | 0.2 /100 | #290 | Tragic 5.3% |
| Immigrants | Bahamas | 0.1 /100 | #291 | Tragic 5.3% |
Demographics Similar to Immigrants from West Indies by 4 or more Vehicles in Household
In terms of 4 or more vehicles in household, the demographic groups most similar to Immigrants from West Indies are Immigrants from Belarus (4.7%, a difference of 0.090%), Puerto Rican (4.7%, a difference of 0.53%), Immigrants from Israel (4.8%, a difference of 0.79%), Albanian (4.8%, a difference of 0.81%), and U.S. Virgin Islander (4.6%, a difference of 2.2%).
| Demographics | Rating | Rank | 4 or more Vehicles in Household |
| Menominee | 0.0 /100 | #307 | Tragic 5.0% |
| Paraguayans | 0.0 /100 | #308 | Tragic 4.9% |
| Immigrants | Somalia | 0.0 /100 | #309 | Tragic 4.9% |
| Moroccans | 0.0 /100 | #310 | Tragic 4.9% |
| Houma | 0.0 /100 | #311 | Tragic 4.9% |
| Albanians | 0.0 /100 | #312 | Tragic 4.8% |
| Immigrants | Israel | 0.0 /100 | #313 | Tragic 4.8% |
| Immigrants | West Indies | 0.0 /100 | #314 | Tragic 4.7% |
| Immigrants | Belarus | 0.0 /100 | #315 | Tragic 4.7% |
| Puerto Ricans | 0.0 /100 | #316 | Tragic 4.7% |
| U.S. Virgin Islanders | 0.0 /100 | #317 | Tragic 4.6% |
| Jamaicans | 0.0 /100 | #318 | Tragic 4.6% |
| Haitians | 0.0 /100 | #319 | Tragic 4.6% |
| Immigrants | Haiti | 0.0 /100 | #320 | Tragic 4.5% |
| Ecuadorians | 0.0 /100 | #321 | Tragic 4.5% |