Immigrants from Armenia vs Immigrants from West Indies 4 or more Vehicles in Household
COMPARE
Immigrants from Armenia
Immigrants from West Indies
4 or more Vehicles in Household
4 or more Vehicles in Household Comparison
Immigrants from Armenia
Immigrants from West Indies
6.5%
4 OR MORE VEHICLES IN HOUSEHOLD
71.2/ 100
METRIC RATING
153rd/ 347
METRIC RANK
4.7%
4 OR MORE VEHICLES IN HOUSEHOLD
0.0/ 100
METRIC RATING
314th/ 347
METRIC RANK
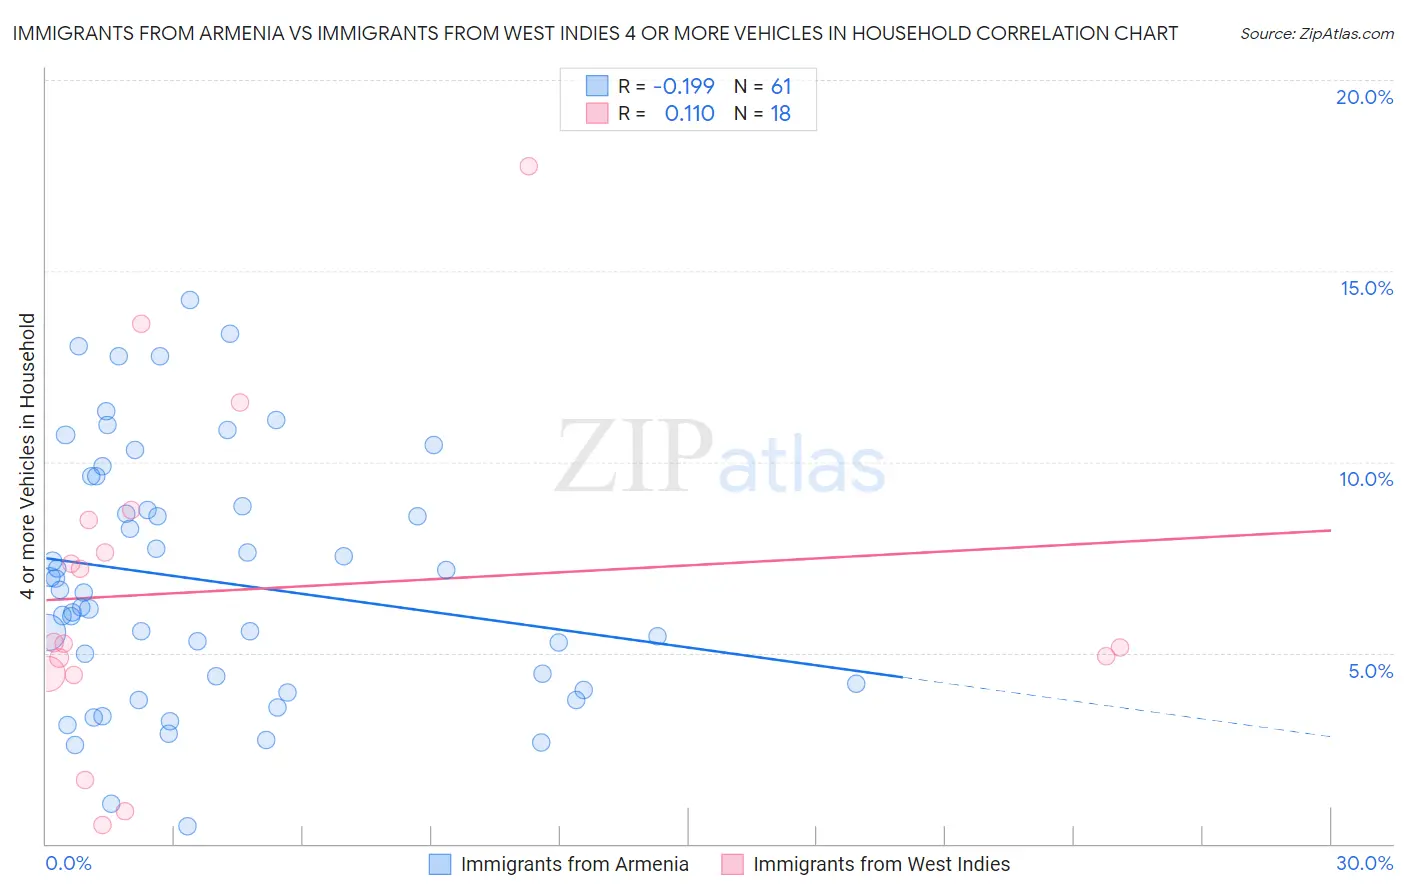
Immigrants from Armenia vs Immigrants from West Indies 4 or more Vehicles in Household Correlation Chart
The statistical analysis conducted on geographies consisting of 97,454,619 people shows a poor negative correlation between the proportion of Immigrants from Armenia and percentage of households with 4 or more vehicles available in the United States with a correlation coefficient (R) of -0.199 and weighted average of 6.5%. Similarly, the statistical analysis conducted on geographies consisting of 72,052,209 people shows a poor positive correlation between the proportion of Immigrants from West Indies and percentage of households with 4 or more vehicles available in the United States with a correlation coefficient (R) of 0.110 and weighted average of 4.7%, a difference of 36.3%.
4 or more Vehicles in Household Correlation Summary
| Measurement | Immigrants from Armenia | Immigrants from West Indies |
| Minimum | 0.45% | 0.50% |
| Maximum | 14.3% | 17.7% |
| Range | 13.8% | 17.2% |
| Mean | 6.9% | 6.6% |
| Median | 6.6% | 5.3% |
| Interquartile 25% (IQ1) | 4.1% | 4.5% |
| Interquartile 75% (IQ3) | 9.2% | 8.5% |
| Interquartile Range (IQR) | 5.1% | 4.0% |
| Standard Deviation (Sample) | 3.3% | 4.4% |
| Standard Deviation (Population) | 3.2% | 4.2% |
Similar Demographics by 4 or more Vehicles in Household
Demographics Similar to Immigrants from Armenia by 4 or more Vehicles in Household
In terms of 4 or more vehicles in household, the demographic groups most similar to Immigrants from Armenia are Central American Indian (6.5%, a difference of 0.010%), Iroquois (6.5%, a difference of 0.090%), Yuman (6.5%, a difference of 0.11%), Immigrants from Hong Kong (6.5%, a difference of 0.13%), and Iranian (6.5%, a difference of 0.16%).
| Demographics | Rating | Rank | 4 or more Vehicles in Household |
| Immigrants | Costa Rica | 74.4 /100 | #146 | Good 6.5% |
| Immigrants | Iran | 73.9 /100 | #147 | Good 6.5% |
| Immigrants | Jordan | 73.7 /100 | #148 | Good 6.5% |
| Greeks | 73.6 /100 | #149 | Good 6.5% |
| New Zealanders | 73.3 /100 | #150 | Good 6.5% |
| Immigrants | Hong Kong | 72.2 /100 | #151 | Good 6.5% |
| Yuman | 72.1 /100 | #152 | Good 6.5% |
| Immigrants | Armenia | 71.2 /100 | #153 | Good 6.5% |
| Central American Indians | 71.1 /100 | #154 | Good 6.5% |
| Iroquois | 70.4 /100 | #155 | Good 6.5% |
| Iranians | 69.9 /100 | #156 | Good 6.5% |
| Peruvians | 69.4 /100 | #157 | Good 6.5% |
| Zimbabweans | 67.1 /100 | #158 | Good 6.4% |
| Indians (Asian) | 66.3 /100 | #159 | Good 6.4% |
| Palestinians | 65.8 /100 | #160 | Good 6.4% |
Demographics Similar to Immigrants from West Indies by 4 or more Vehicles in Household
In terms of 4 or more vehicles in household, the demographic groups most similar to Immigrants from West Indies are Immigrants from Belarus (4.7%, a difference of 0.090%), Puerto Rican (4.7%, a difference of 0.53%), Immigrants from Israel (4.8%, a difference of 0.79%), Albanian (4.8%, a difference of 0.81%), and U.S. Virgin Islander (4.6%, a difference of 2.2%).
| Demographics | Rating | Rank | 4 or more Vehicles in Household |
| Menominee | 0.0 /100 | #307 | Tragic 5.0% |
| Paraguayans | 0.0 /100 | #308 | Tragic 4.9% |
| Immigrants | Somalia | 0.0 /100 | #309 | Tragic 4.9% |
| Moroccans | 0.0 /100 | #310 | Tragic 4.9% |
| Houma | 0.0 /100 | #311 | Tragic 4.9% |
| Albanians | 0.0 /100 | #312 | Tragic 4.8% |
| Immigrants | Israel | 0.0 /100 | #313 | Tragic 4.8% |
| Immigrants | West Indies | 0.0 /100 | #314 | Tragic 4.7% |
| Immigrants | Belarus | 0.0 /100 | #315 | Tragic 4.7% |
| Puerto Ricans | 0.0 /100 | #316 | Tragic 4.7% |
| U.S. Virgin Islanders | 0.0 /100 | #317 | Tragic 4.6% |
| Jamaicans | 0.0 /100 | #318 | Tragic 4.6% |
| Haitians | 0.0 /100 | #319 | Tragic 4.6% |
| Immigrants | Haiti | 0.0 /100 | #320 | Tragic 4.5% |
| Ecuadorians | 0.0 /100 | #321 | Tragic 4.5% |