Sri Lankan vs Immigrants from West Indies 4th Grade
COMPARE
Sri Lankan
Immigrants from West Indies
4th Grade
4th Grade Comparison
Sri Lankans
Immigrants from West Indies
96.4%
4TH GRADE
0.0/ 100
METRIC RATING
306th/ 347
METRIC RANK
96.7%
4TH GRADE
0.0/ 100
METRIC RATING
289th/ 347
METRIC RANK
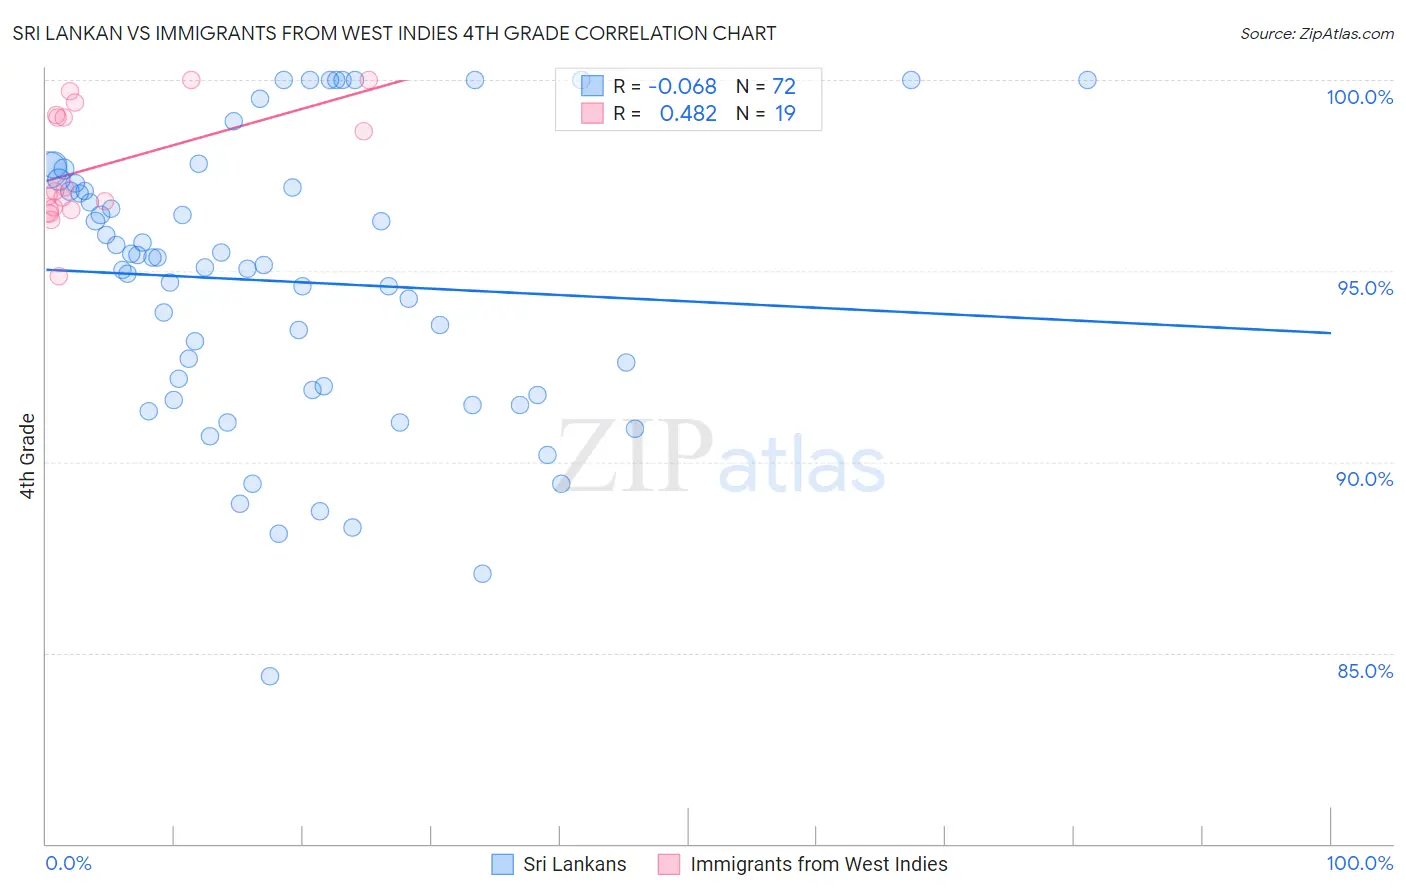
Sri Lankan vs Immigrants from West Indies 4th Grade Correlation Chart
The statistical analysis conducted on geographies consisting of 440,593,746 people shows a slight negative correlation between the proportion of Sri Lankans and percentage of population with at least 4th grade education in the United States with a correlation coefficient (R) of -0.068 and weighted average of 96.4%. Similarly, the statistical analysis conducted on geographies consisting of 72,457,514 people shows a moderate positive correlation between the proportion of Immigrants from West Indies and percentage of population with at least 4th grade education in the United States with a correlation coefficient (R) of 0.482 and weighted average of 96.7%, a difference of 0.41%.
4th Grade Correlation Summary
| Measurement | Sri Lankan | Immigrants from West Indies |
| Minimum | 84.4% | 94.9% |
| Maximum | 100.0% | 100.0% |
| Range | 15.6% | 5.1% |
| Mean | 94.7% | 97.8% |
| Median | 95.3% | 97.1% |
| Interquartile 25% (IQ1) | 91.8% | 96.6% |
| Interquartile 75% (IQ3) | 97.2% | 99.1% |
| Interquartile Range (IQR) | 5.4% | 2.5% |
| Standard Deviation (Sample) | 3.7% | 1.5% |
| Standard Deviation (Population) | 3.7% | 1.5% |
Demographics Similar to Sri Lankans and Immigrants from West Indies by 4th Grade
In terms of 4th grade, the demographic groups most similar to Sri Lankans are Immigrants from Caribbean (96.4%, a difference of 0.010%), Ecuadorian (96.4%, a difference of 0.030%), Immigrants from Haiti (96.3%, a difference of 0.030%), Guyanese (96.4%, a difference of 0.040%), and Immigrants from Cuba (96.4%, a difference of 0.090%). Similarly, the demographic groups most similar to Immigrants from West Indies are British West Indian (96.7%, a difference of 0.010%), Houma (96.8%, a difference of 0.020%), Immigrants from Afghanistan (96.8%, a difference of 0.020%), Immigrants from Grenada (96.7%, a difference of 0.040%), and Malaysian (96.7%, a difference of 0.050%).
| Demographics | Rating | Rank | 4th Grade |
| Houma | 0.0 /100 | #287 | Tragic 96.8% |
| Immigrants | Afghanistan | 0.0 /100 | #288 | Tragic 96.8% |
| Immigrants | West Indies | 0.0 /100 | #289 | Tragic 96.7% |
| British West Indians | 0.0 /100 | #290 | Tragic 96.7% |
| Immigrants | Grenada | 0.0 /100 | #291 | Tragic 96.7% |
| Malaysians | 0.0 /100 | #292 | Tragic 96.7% |
| Puerto Ricans | 0.0 /100 | #293 | Tragic 96.7% |
| Immigrants | Eritrea | 0.0 /100 | #294 | Tragic 96.7% |
| Immigrants | Portugal | 0.0 /100 | #295 | Tragic 96.6% |
| Somalis | 0.0 /100 | #296 | Tragic 96.6% |
| Immigrants | Somalia | 0.0 /100 | #297 | Tragic 96.5% |
| Haitians | 0.0 /100 | #298 | Tragic 96.5% |
| Immigrants | Dominica | 0.0 /100 | #299 | Tragic 96.5% |
| Immigrants | South Eastern Asia | 0.0 /100 | #300 | Tragic 96.5% |
| Immigrants | Immigrants | 0.0 /100 | #301 | Tragic 96.5% |
| Immigrants | Cuba | 0.0 /100 | #302 | Tragic 96.4% |
| Guyanese | 0.0 /100 | #303 | Tragic 96.4% |
| Ecuadorians | 0.0 /100 | #304 | Tragic 96.4% |
| Immigrants | Caribbean | 0.0 /100 | #305 | Tragic 96.4% |
| Sri Lankans | 0.0 /100 | #306 | Tragic 96.4% |
| Immigrants | Haiti | 0.0 /100 | #307 | Tragic 96.3% |