Spanish vs Thai 2 or more Vehicles in Household
COMPARE
Spanish
Thai
2 or more Vehicles in Household
2 or more Vehicles in Household Comparison
Spanish
Thais
60.2%
2 OR MORE VEHICLES IN HOUSEHOLD
100.0/ 100
METRIC RATING
34th/ 347
METRIC RANK
57.9%
2 OR MORE VEHICLES IN HOUSEHOLD
99.1/ 100
METRIC RATING
87th/ 347
METRIC RANK
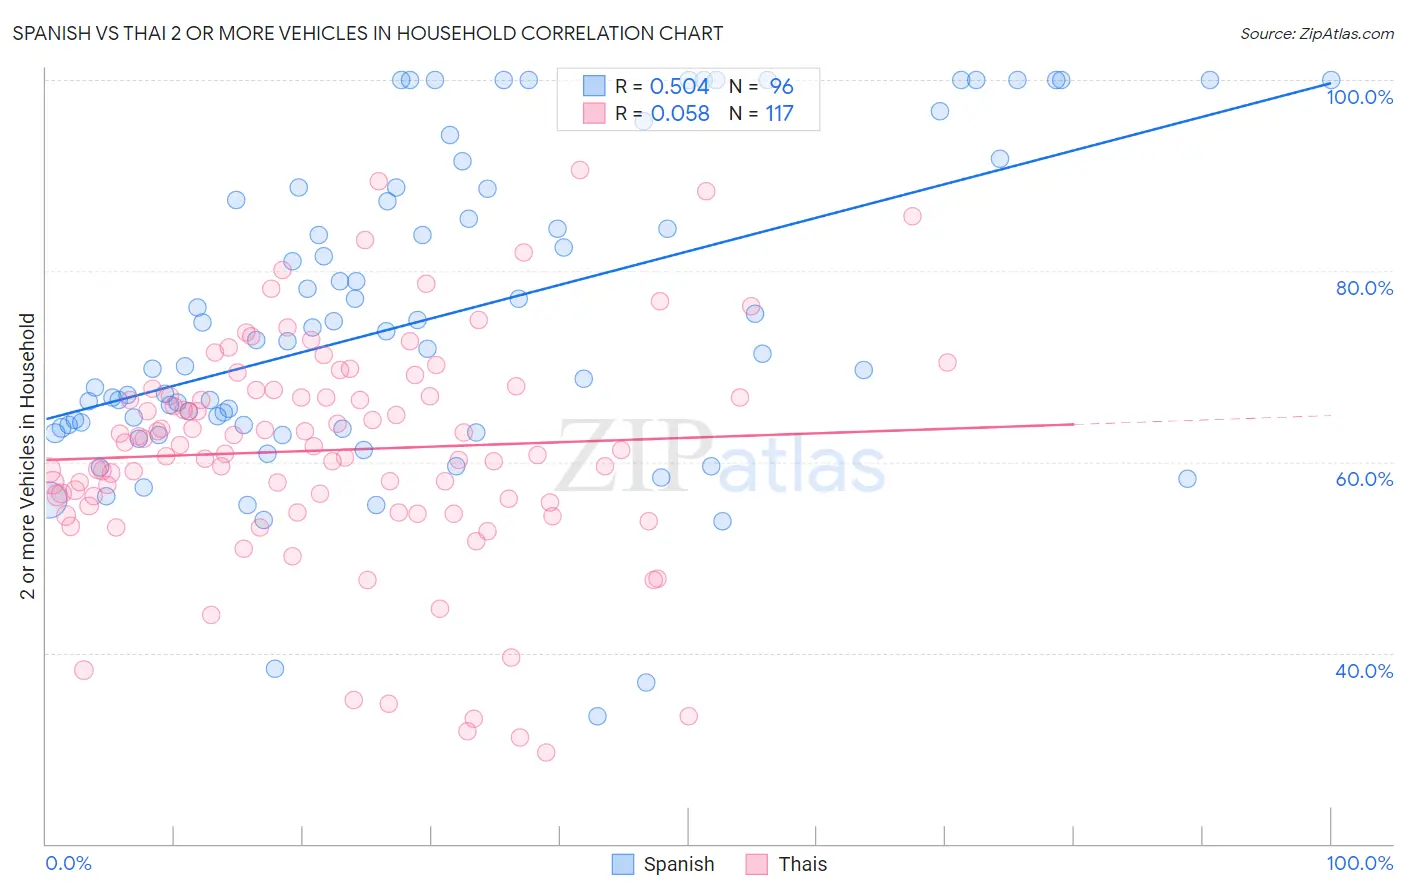
Spanish vs Thai 2 or more Vehicles in Household Correlation Chart
The statistical analysis conducted on geographies consisting of 421,956,041 people shows a substantial positive correlation between the proportion of Spanish and percentage of households with 2 or more vehicles available in the United States with a correlation coefficient (R) of 0.504 and weighted average of 60.2%. Similarly, the statistical analysis conducted on geographies consisting of 475,419,380 people shows a slight positive correlation between the proportion of Thais and percentage of households with 2 or more vehicles available in the United States with a correlation coefficient (R) of 0.058 and weighted average of 57.9%, a difference of 3.9%.
2 or more Vehicles in Household Correlation Summary
| Measurement | Spanish | Thai |
| Minimum | 33.3% | 29.5% |
| Maximum | 100.0% | 90.5% |
| Range | 66.7% | 61.0% |
| Mean | 74.9% | 61.2% |
| Median | 72.2% | 61.6% |
| Interquartile 25% (IQ1) | 63.7% | 55.6% |
| Interquartile 75% (IQ3) | 88.0% | 67.5% |
| Interquartile Range (IQR) | 24.3% | 11.9% |
| Standard Deviation (Sample) | 16.2% | 12.0% |
| Standard Deviation (Population) | 16.1% | 11.9% |
Similar Demographics by 2 or more Vehicles in Household
Demographics Similar to Spanish by 2 or more Vehicles in Household
In terms of 2 or more vehicles in household, the demographic groups most similar to Spanish are Immigrants from Mexico (60.2%, a difference of 0.050%), Arapaho (60.2%, a difference of 0.11%), Immigrants from Philippines (60.1%, a difference of 0.12%), Chinese (60.1%, a difference of 0.14%), and Irish (60.1%, a difference of 0.18%).
| Demographics | Rating | Rank | 2 or more Vehicles in Household |
| Assyrians/Chaldeans/Syriacs | 100.0 /100 | #27 | Exceptional 60.5% |
| Guamanians/Chamorros | 100.0 /100 | #28 | Exceptional 60.5% |
| Hawaiians | 100.0 /100 | #29 | Exceptional 60.4% |
| Finns | 100.0 /100 | #30 | Exceptional 60.3% |
| Spanish American Indians | 100.0 /100 | #31 | Exceptional 60.3% |
| Arapaho | 100.0 /100 | #32 | Exceptional 60.2% |
| Immigrants | Mexico | 100.0 /100 | #33 | Exceptional 60.2% |
| Spanish | 100.0 /100 | #34 | Exceptional 60.2% |
| Immigrants | Philippines | 100.0 /100 | #35 | Exceptional 60.1% |
| Chinese | 100.0 /100 | #36 | Exceptional 60.1% |
| Irish | 100.0 /100 | #37 | Exceptional 60.1% |
| Americans | 100.0 /100 | #38 | Exceptional 60.0% |
| British | 100.0 /100 | #39 | Exceptional 60.0% |
| Cherokee | 100.0 /100 | #40 | Exceptional 59.9% |
| Northern Europeans | 100.0 /100 | #41 | Exceptional 59.9% |
Demographics Similar to Thais by 2 or more Vehicles in Household
In terms of 2 or more vehicles in household, the demographic groups most similar to Thais are Immigrants from Iran (57.9%, a difference of 0.010%), Potawatomi (58.0%, a difference of 0.040%), Slovak (58.0%, a difference of 0.070%), Immigrants from Germany (57.9%, a difference of 0.080%), and Hispanic or Latino (57.9%, a difference of 0.080%).
| Demographics | Rating | Rank | 2 or more Vehicles in Household |
| Immigrants | England | 99.3 /100 | #80 | Exceptional 58.1% |
| Immigrants | Iraq | 99.3 /100 | #81 | Exceptional 58.1% |
| Iranians | 99.3 /100 | #82 | Exceptional 58.1% |
| Icelanders | 99.2 /100 | #83 | Exceptional 58.0% |
| Maltese | 99.2 /100 | #84 | Exceptional 58.0% |
| Slovaks | 99.2 /100 | #85 | Exceptional 58.0% |
| Potawatomi | 99.1 /100 | #86 | Exceptional 58.0% |
| Thais | 99.1 /100 | #87 | Exceptional 57.9% |
| Immigrants | Iran | 99.1 /100 | #88 | Exceptional 57.9% |
| Immigrants | Germany | 99.0 /100 | #89 | Exceptional 57.9% |
| Hispanics or Latinos | 99.0 /100 | #90 | Exceptional 57.9% |
| Pakistanis | 99.0 /100 | #91 | Exceptional 57.9% |
| Shoshone | 99.0 /100 | #92 | Exceptional 57.9% |
| Ottawa | 99.0 /100 | #93 | Exceptional 57.9% |
| Filipinos | 98.9 /100 | #94 | Exceptional 57.8% |