Spanish vs Tsimshian 4th Grade
COMPARE
Spanish
Tsimshian
4th Grade
4th Grade Comparison
Spanish
Tsimshian
97.8%
4TH GRADE
93.7/ 100
METRIC RATING
124th/ 347
METRIC RANK
98.6%
4TH GRADE
100.0/ 100
METRIC RATING
3rd/ 347
METRIC RANK
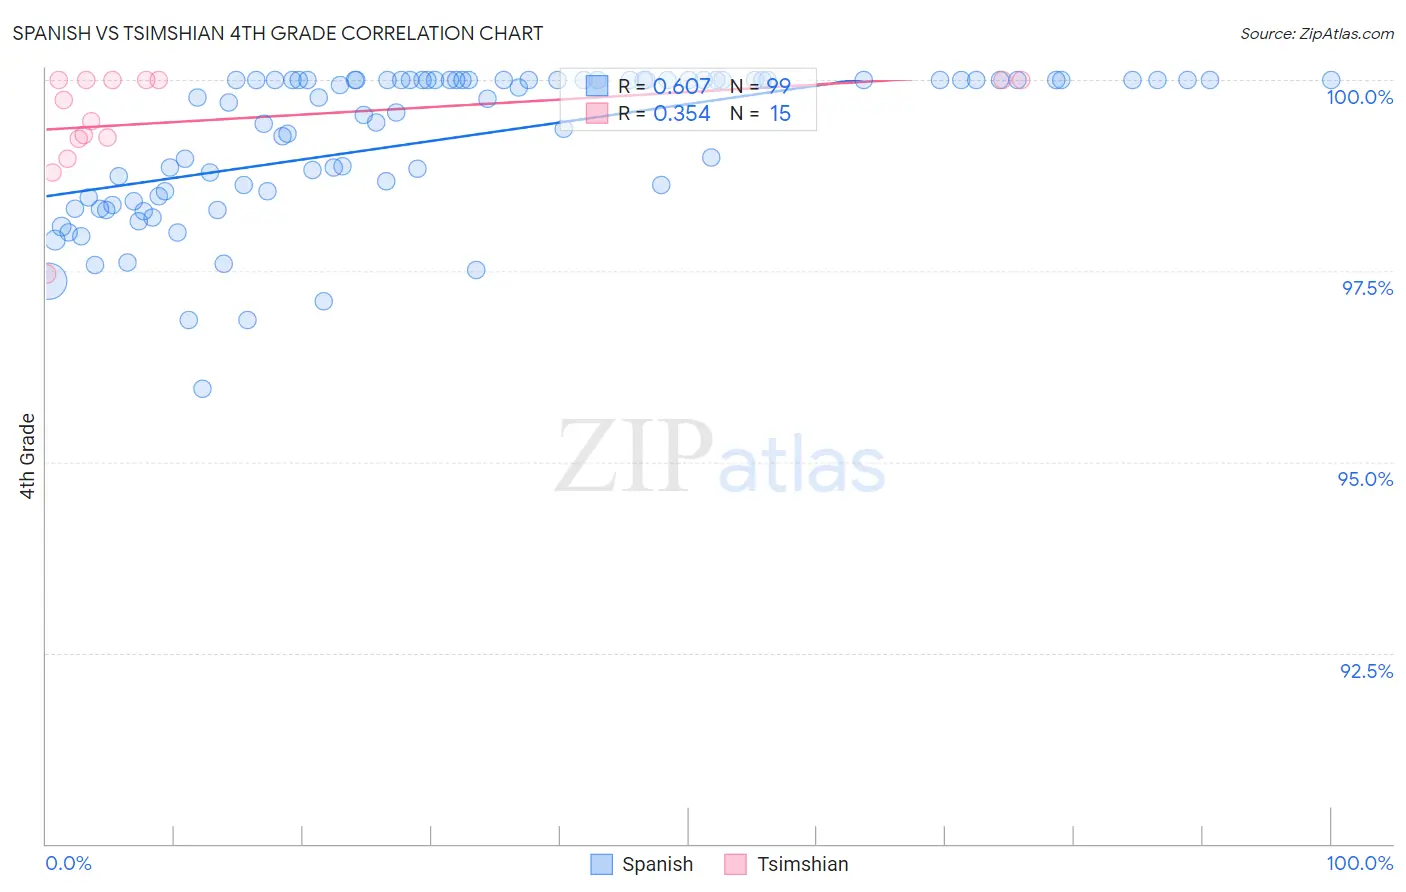
Spanish vs Tsimshian 4th Grade Correlation Chart
The statistical analysis conducted on geographies consisting of 422,189,210 people shows a significant positive correlation between the proportion of Spanish and percentage of population with at least 4th grade education in the United States with a correlation coefficient (R) of 0.607 and weighted average of 97.8%. Similarly, the statistical analysis conducted on geographies consisting of 15,626,544 people shows a mild positive correlation between the proportion of Tsimshian and percentage of population with at least 4th grade education in the United States with a correlation coefficient (R) of 0.354 and weighted average of 98.6%, a difference of 0.88%.
4th Grade Correlation Summary
| Measurement | Spanish | Tsimshian |
| Minimum | 96.0% | 97.5% |
| Maximum | 100.0% | 100.0% |
| Range | 4.0% | 2.5% |
| Mean | 99.2% | 99.5% |
| Median | 99.8% | 99.7% |
| Interquartile 25% (IQ1) | 98.5% | 99.2% |
| Interquartile 75% (IQ3) | 100.0% | 100.0% |
| Interquartile Range (IQR) | 1.5% | 0.77% |
| Standard Deviation (Sample) | 0.97% | 0.70% |
| Standard Deviation (Population) | 0.96% | 0.68% |
Similar Demographics by 4th Grade
Demographics Similar to Spanish by 4th Grade
In terms of 4th grade, the demographic groups most similar to Spanish are Immigrants from Zimbabwe (97.8%, a difference of 0.0%), Immigrants from Norway (97.8%, a difference of 0.010%), Immigrants from Japan (97.8%, a difference of 0.010%), Syrian (97.8%, a difference of 0.020%), and Menominee (97.8%, a difference of 0.020%).
| Demographics | Rating | Rank | 4th Grade |
| Syrians | 94.9 /100 | #117 | Exceptional 97.8% |
| Menominee | 94.9 /100 | #118 | Exceptional 97.8% |
| Immigrants | Saudi Arabia | 94.8 /100 | #119 | Exceptional 97.8% |
| Immigrants | France | 94.8 /100 | #120 | Exceptional 97.8% |
| Immigrants | Norway | 94.2 /100 | #121 | Exceptional 97.8% |
| Immigrants | Japan | 94.1 /100 | #122 | Exceptional 97.8% |
| Immigrants | Zimbabwe | 93.9 /100 | #123 | Exceptional 97.8% |
| Spanish | 93.7 /100 | #124 | Exceptional 97.8% |
| Immigrants | Serbia | 92.6 /100 | #125 | Exceptional 97.8% |
| Immigrants | Europe | 92.5 /100 | #126 | Exceptional 97.8% |
| Colville | 92.3 /100 | #127 | Exceptional 97.7% |
| Pima | 92.0 /100 | #128 | Exceptional 97.7% |
| Immigrants | Bulgaria | 91.3 /100 | #129 | Exceptional 97.7% |
| Immigrants | Romania | 90.6 /100 | #130 | Exceptional 97.7% |
| Immigrants | Kuwait | 89.7 /100 | #131 | Excellent 97.7% |
Demographics Similar to Tsimshian by 4th Grade
In terms of 4th grade, the demographic groups most similar to Tsimshian are Welsh (98.7%, a difference of 0.060%), Inupiat (98.6%, a difference of 0.060%), Yup'ik (98.5%, a difference of 0.090%), Norwegian (98.5%, a difference of 0.13%), and Slovak (98.5%, a difference of 0.14%).
| Demographics | Rating | Rank | 4th Grade |
| Crow | 100.0 /100 | #1 | Exceptional 99.6% |
| Welsh | 100.0 /100 | #2 | Exceptional 98.7% |
| Tsimshian | 100.0 /100 | #3 | Exceptional 98.6% |
| Inupiat | 100.0 /100 | #4 | Exceptional 98.6% |
| Yup'ik | 100.0 /100 | #5 | Exceptional 98.5% |
| Norwegians | 100.0 /100 | #6 | Exceptional 98.5% |
| Slovaks | 100.0 /100 | #7 | Exceptional 98.5% |
| Germans | 100.0 /100 | #8 | Exceptional 98.5% |
| Slovenes | 100.0 /100 | #9 | Exceptional 98.4% |
| Alaskan Athabascans | 100.0 /100 | #10 | Exceptional 98.4% |
| English | 100.0 /100 | #11 | Exceptional 98.4% |
| Tlingit-Haida | 100.0 /100 | #12 | Exceptional 98.4% |
| Swedes | 100.0 /100 | #13 | Exceptional 98.4% |
| Carpatho Rusyns | 100.0 /100 | #14 | Exceptional 98.4% |
| Dutch | 100.0 /100 | #15 | Exceptional 98.4% |