Spanish vs Aleut In Labor Force | Age 20-64
COMPARE
Spanish
Aleut
In Labor Force | Age 20-64
In Labor Force | Age 20-64 Comparison
Spanish
Aleuts
78.2%
IN LABOR FORCE | AGE 20-64
0.0/ 100
METRIC RATING
275th/ 347
METRIC RANK
78.2%
IN LABOR FORCE | AGE 20-64
0.0/ 100
METRIC RATING
274th/ 347
METRIC RANK
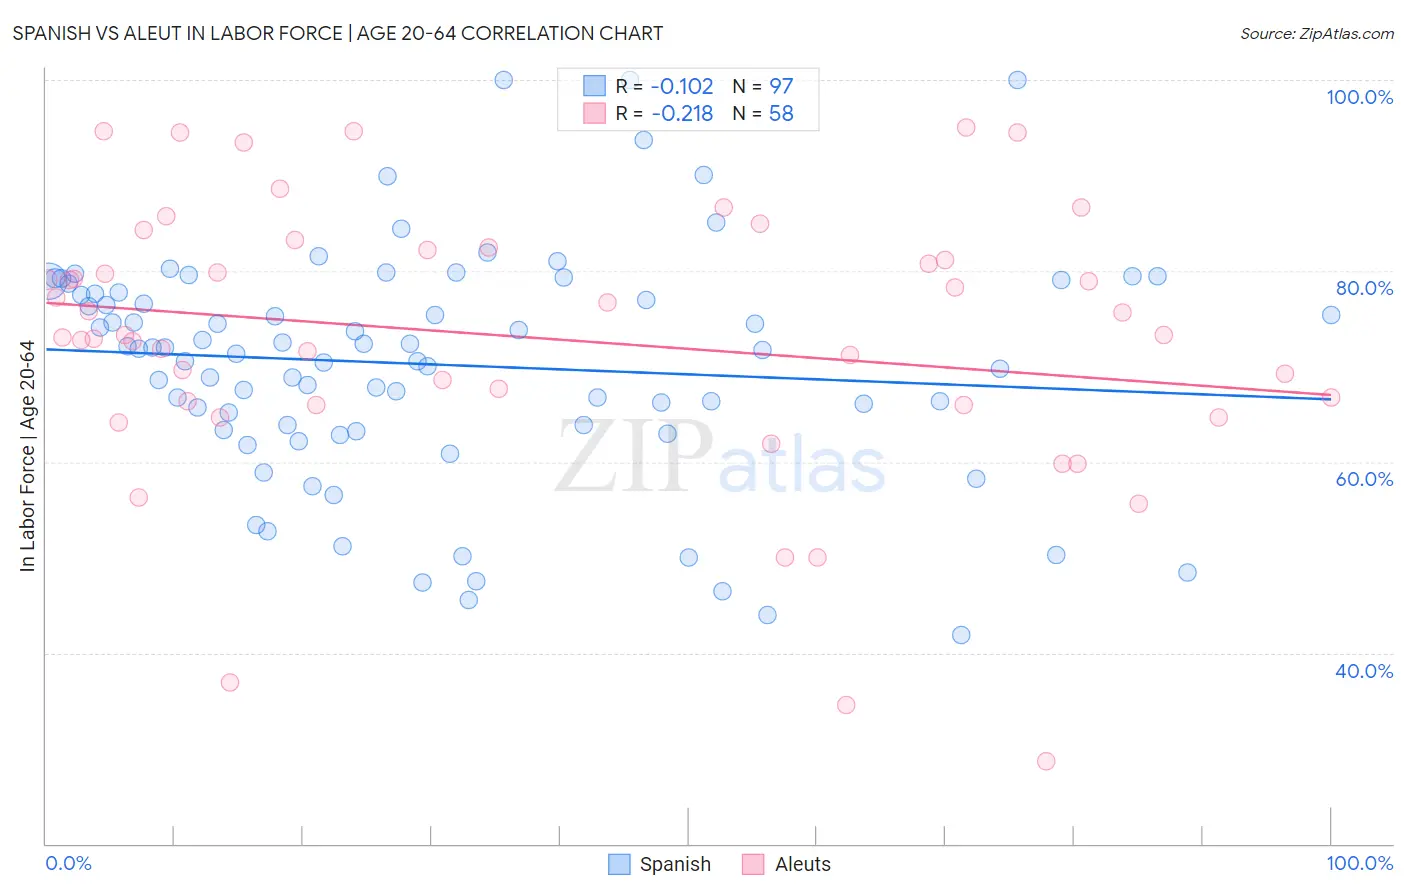
Spanish vs Aleut In Labor Force | Age 20-64 Correlation Chart
The statistical analysis conducted on geographies consisting of 422,183,269 people shows a poor negative correlation between the proportion of Spanish and labor force participation rate among population between the ages 20 and 64 in the United States with a correlation coefficient (R) of -0.102 and weighted average of 78.2%. Similarly, the statistical analysis conducted on geographies consisting of 61,782,784 people shows a weak negative correlation between the proportion of Aleuts and labor force participation rate among population between the ages 20 and 64 in the United States with a correlation coefficient (R) of -0.218 and weighted average of 78.2%, a difference of 0.010%.
In Labor Force | Age 20-64 Correlation Summary
| Measurement | Spanish | Aleut |
| Minimum | 41.9% | 28.6% |
| Maximum | 100.0% | 95.0% |
| Range | 58.1% | 66.4% |
| Mean | 70.2% | 73.0% |
| Median | 71.9% | 73.3% |
| Interquartile 25% (IQ1) | 63.6% | 66.0% |
| Interquartile 75% (IQ3) | 78.2% | 82.2% |
| Interquartile Range (IQR) | 14.7% | 16.2% |
| Standard Deviation (Sample) | 12.1% | 14.4% |
| Standard Deviation (Population) | 12.1% | 14.3% |
Demographics Similar to Spanish and Aleuts by In Labor Force | Age 20-64
In terms of in labor force | age 20-64, the demographic groups most similar to Spanish are Puget Sound Salish (78.2%, a difference of 0.0%), Immigrants from Bahamas (78.2%, a difference of 0.020%), Mexican American Indian (78.2%, a difference of 0.020%), French American Indian (78.2%, a difference of 0.030%), and Marshallese (78.3%, a difference of 0.070%). Similarly, the demographic groups most similar to Aleuts are Puget Sound Salish (78.2%, a difference of 0.010%), French American Indian (78.2%, a difference of 0.020%), Immigrants from Bahamas (78.2%, a difference of 0.020%), Mexican American Indian (78.2%, a difference of 0.030%), and Immigrants from Latin America (78.3%, a difference of 0.070%).
| Demographics | Rating | Rank | In Labor Force | Age 20-64 |
| Spaniards | 0.1 /100 | #264 | Tragic 78.4% |
| British West Indians | 0.1 /100 | #265 | Tragic 78.4% |
| Bahamians | 0.1 /100 | #266 | Tragic 78.4% |
| U.S. Virgin Islanders | 0.1 /100 | #267 | Tragic 78.4% |
| West Indians | 0.0 /100 | #268 | Tragic 78.3% |
| Immigrants | Barbados | 0.0 /100 | #269 | Tragic 78.3% |
| Scotch-Irish | 0.0 /100 | #270 | Tragic 78.3% |
| Immigrants | Latin America | 0.0 /100 | #271 | Tragic 78.3% |
| Marshallese | 0.0 /100 | #272 | Tragic 78.3% |
| French American Indians | 0.0 /100 | #273 | Tragic 78.2% |
| Aleuts | 0.0 /100 | #274 | Tragic 78.2% |
| Spanish | 0.0 /100 | #275 | Tragic 78.2% |
| Puget Sound Salish | 0.0 /100 | #276 | Tragic 78.2% |
| Immigrants | Bahamas | 0.0 /100 | #277 | Tragic 78.2% |
| Mexican American Indians | 0.0 /100 | #278 | Tragic 78.2% |
| Belizeans | 0.0 /100 | #279 | Tragic 78.2% |
| Immigrants | Dominica | 0.0 /100 | #280 | Tragic 78.1% |
| Guyanese | 0.0 /100 | #281 | Tragic 78.1% |
| Immigrants | St. Vincent and the Grenadines | 0.0 /100 | #282 | Tragic 78.1% |
| Immigrants | Nonimmigrants | 0.0 /100 | #283 | Tragic 78.1% |
| Immigrants | Guyana | 0.0 /100 | #284 | Tragic 78.1% |