Spanish American Indian vs Bermudan 3 or more Vehicles in Household
COMPARE
Spanish American Indian
Bermudan
3 or more Vehicles in Household
3 or more Vehicles in Household Comparison
Spanish American Indians
Bermudans
26.9%
3 OR MORE VEHICLES IN HOUSEHOLD
100.0/ 100
METRIC RATING
2nd/ 347
METRIC RANK
17.8%
3 OR MORE VEHICLES IN HOUSEHOLD
0.9/ 100
METRIC RATING
263rd/ 347
METRIC RANK
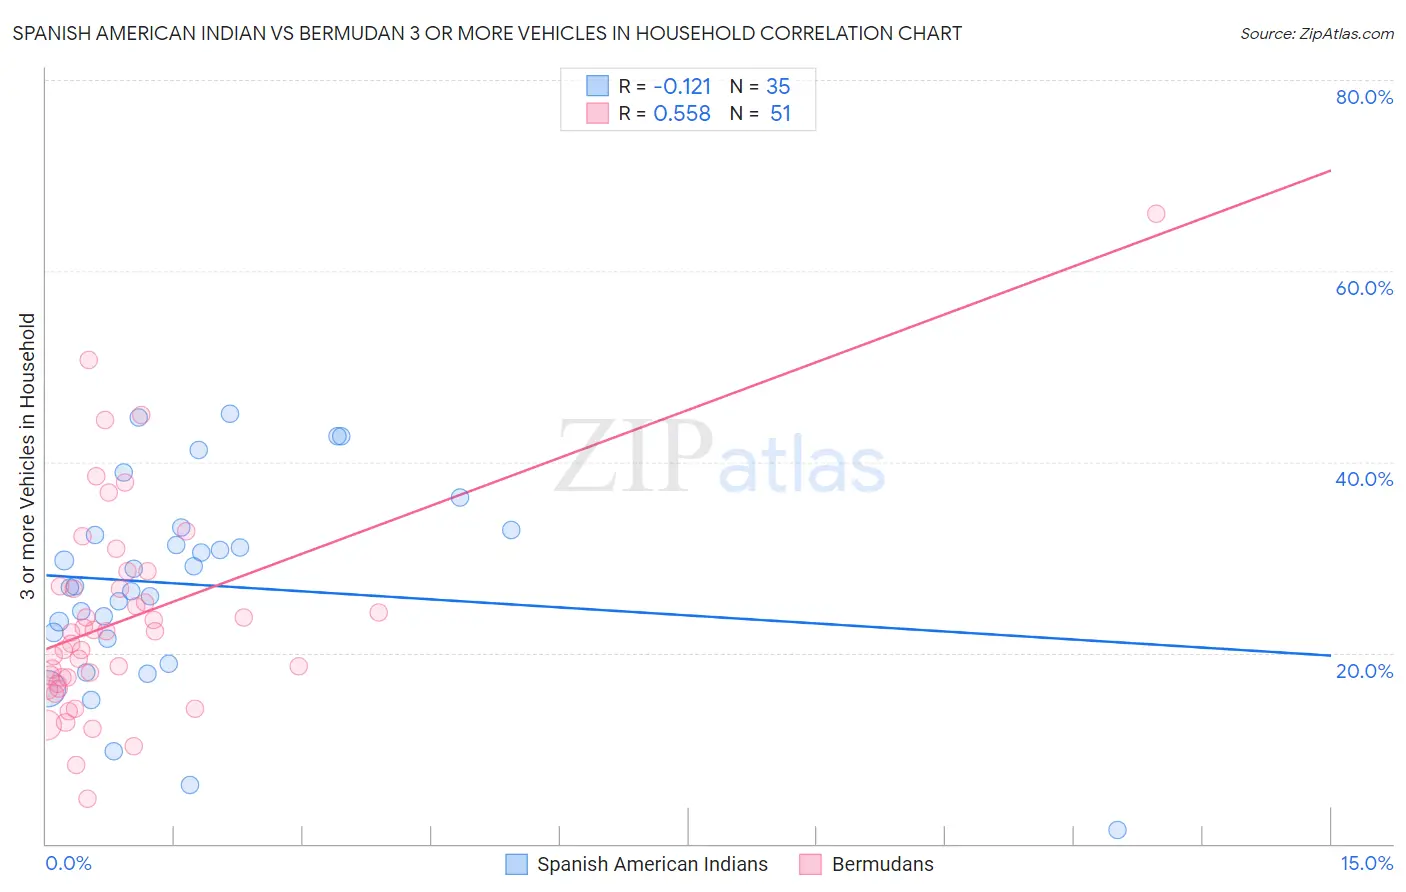
Spanish American Indian vs Bermudan 3 or more Vehicles in Household Correlation Chart
The statistical analysis conducted on geographies consisting of 73,145,550 people shows a poor negative correlation between the proportion of Spanish American Indians and percentage of households with 3 or more vehicles available in the United States with a correlation coefficient (R) of -0.121 and weighted average of 26.9%. Similarly, the statistical analysis conducted on geographies consisting of 55,710,520 people shows a substantial positive correlation between the proportion of Bermudans and percentage of households with 3 or more vehicles available in the United States with a correlation coefficient (R) of 0.558 and weighted average of 17.8%, a difference of 51.7%.
3 or more Vehicles in Household Correlation Summary
| Measurement | Spanish American Indian | Bermudan |
| Minimum | 1.4% | 4.8% |
| Maximum | 45.0% | 66.0% |
| Range | 43.6% | 61.2% |
| Mean | 27.2% | 23.6% |
| Median | 27.0% | 22.1% |
| Interquartile 25% (IQ1) | 21.5% | 16.7% |
| Interquartile 75% (IQ3) | 32.8% | 27.0% |
| Interquartile Range (IQR) | 11.3% | 10.3% |
| Standard Deviation (Sample) | 10.4% | 11.2% |
| Standard Deviation (Population) | 10.3% | 11.1% |
Similar Demographics by 3 or more Vehicles in Household
Demographics Similar to Spanish American Indians by 3 or more Vehicles in Household
In terms of 3 or more vehicles in household, the demographic groups most similar to Spanish American Indians are Tongan (26.5%, a difference of 1.5%), Arapaho (26.4%, a difference of 1.8%), Puget Sound Salish (26.4%, a difference of 2.2%), Immigrants from Fiji (26.1%, a difference of 3.4%), and Colville (25.8%, a difference of 4.6%).
| Demographics | Rating | Rank | 3 or more Vehicles in Household |
| Yakama | 100.0 /100 | #1 | Exceptional 31.0% |
| Spanish American Indians | 100.0 /100 | #2 | Exceptional 26.9% |
| Tongans | 100.0 /100 | #3 | Exceptional 26.5% |
| Arapaho | 100.0 /100 | #4 | Exceptional 26.4% |
| Puget Sound Salish | 100.0 /100 | #5 | Exceptional 26.4% |
| Immigrants | Fiji | 100.0 /100 | #6 | Exceptional 26.1% |
| Colville | 100.0 /100 | #7 | Exceptional 25.8% |
| Samoans | 100.0 /100 | #8 | Exceptional 25.0% |
| Native Hawaiians | 100.0 /100 | #9 | Exceptional 24.9% |
| Nepalese | 100.0 /100 | #10 | Exceptional 24.9% |
| Shoshone | 100.0 /100 | #11 | Exceptional 24.9% |
| Danes | 100.0 /100 | #12 | Exceptional 24.7% |
| Mexicans | 100.0 /100 | #13 | Exceptional 24.7% |
| Immigrants | Mexico | 100.0 /100 | #14 | Exceptional 24.6% |
| Hawaiians | 100.0 /100 | #15 | Exceptional 24.3% |
Demographics Similar to Bermudans by 3 or more Vehicles in Household
In terms of 3 or more vehicles in household, the demographic groups most similar to Bermudans are Cambodian (17.8%, a difference of 0.030%), Colombian (17.8%, a difference of 0.11%), Immigrants from Northern Africa (17.8%, a difference of 0.14%), Ugandan (17.8%, a difference of 0.16%), and Immigrants from Panama (17.7%, a difference of 0.16%).
| Demographics | Rating | Rank | 3 or more Vehicles in Household |
| Sub-Saharan Africans | 1.1 /100 | #256 | Tragic 17.9% |
| Immigrants | Eritrea | 1.1 /100 | #257 | Tragic 17.8% |
| Sudanese | 1.1 /100 | #258 | Tragic 17.8% |
| Uruguayans | 1.0 /100 | #259 | Tragic 17.8% |
| Ugandans | 0.9 /100 | #260 | Tragic 17.8% |
| Immigrants | Northern Africa | 0.9 /100 | #261 | Tragic 17.8% |
| Colombians | 0.9 /100 | #262 | Tragic 17.8% |
| Bermudans | 0.9 /100 | #263 | Tragic 17.8% |
| Cambodians | 0.9 /100 | #264 | Tragic 17.8% |
| Immigrants | Panama | 0.8 /100 | #265 | Tragic 17.7% |
| Macedonians | 0.8 /100 | #266 | Tragic 17.7% |
| Immigrants | Venezuela | 0.8 /100 | #267 | Tragic 17.7% |
| Immigrants | Bulgaria | 0.8 /100 | #268 | Tragic 17.7% |
| Immigrants | France | 0.6 /100 | #269 | Tragic 17.6% |
| Immigrants | Nepal | 0.6 /100 | #270 | Tragic 17.6% |