Soviet Union vs Immigrants from Somalia 2 or more Vehicles in Household
COMPARE
Soviet Union
Immigrants from Somalia
2 or more Vehicles in Household
2 or more Vehicles in Household Comparison
Soviet Union
Immigrants from Somalia
45.7%
2 OR MORE VEHICLES IN HOUSEHOLD
0.0/ 100
METRIC RATING
320th/ 347
METRIC RANK
50.5%
2 OR MORE VEHICLES IN HOUSEHOLD
0.0/ 100
METRIC RATING
296th/ 347
METRIC RANK
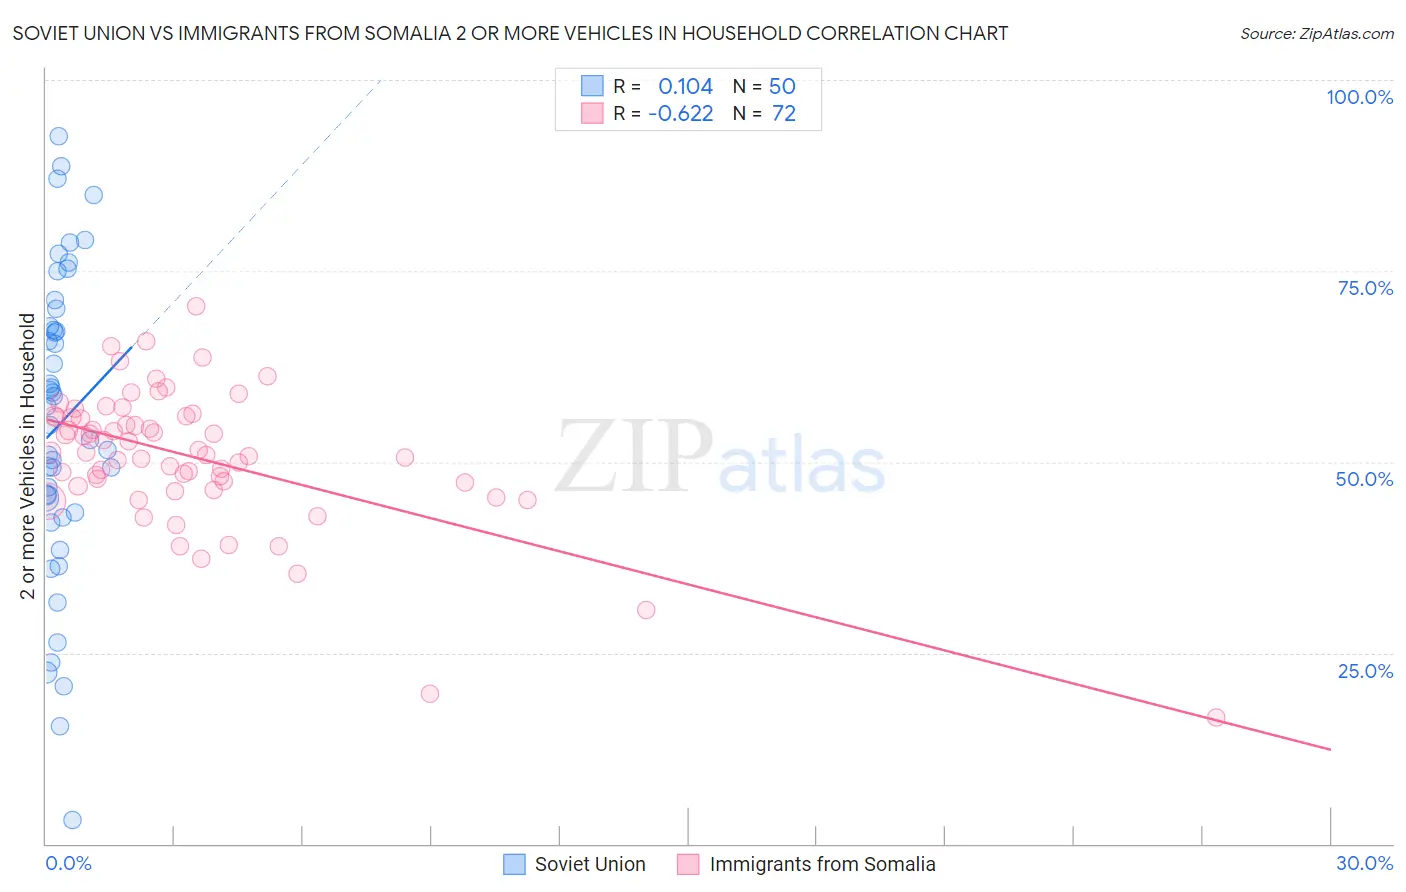
Soviet Union vs Immigrants from Somalia 2 or more Vehicles in Household Correlation Chart
The statistical analysis conducted on geographies consisting of 43,509,630 people shows a poor positive correlation between the proportion of Soviet Union and percentage of households with 2 or more vehicles available in the United States with a correlation coefficient (R) of 0.104 and weighted average of 45.7%. Similarly, the statistical analysis conducted on geographies consisting of 92,099,501 people shows a significant negative correlation between the proportion of Immigrants from Somalia and percentage of households with 2 or more vehicles available in the United States with a correlation coefficient (R) of -0.622 and weighted average of 50.5%, a difference of 10.5%.
2 or more Vehicles in Household Correlation Summary
| Measurement | Soviet Union | Immigrants from Somalia |
| Minimum | 3.0% | 16.4% |
| Maximum | 92.6% | 70.3% |
| Range | 89.6% | 53.8% |
| Mean | 54.9% | 50.6% |
| Median | 56.1% | 51.2% |
| Interquartile 25% (IQ1) | 43.4% | 47.1% |
| Interquartile 75% (IQ3) | 67.8% | 55.9% |
| Interquartile Range (IQR) | 24.4% | 8.8% |
| Standard Deviation (Sample) | 20.0% | 9.2% |
| Standard Deviation (Population) | 19.8% | 9.1% |
Similar Demographics by 2 or more Vehicles in Household
Demographics Similar to Soviet Union by 2 or more Vehicles in Household
In terms of 2 or more vehicles in household, the demographic groups most similar to Soviet Union are Jamaican (45.8%, a difference of 0.060%), Immigrants from Albania (46.0%, a difference of 0.58%), Immigrants from Haiti (46.5%, a difference of 1.7%), Cape Verdean (46.8%, a difference of 2.3%), and Immigrants from Jamaica (44.5%, a difference of 2.9%).
| Demographics | Rating | Rank | 2 or more Vehicles in Household |
| U.S. Virgin Islanders | 0.0 /100 | #313 | Tragic 47.5% |
| Immigrants | Ghana | 0.0 /100 | #314 | Tragic 47.4% |
| Puerto Ricans | 0.0 /100 | #315 | Tragic 47.1% |
| Cape Verdeans | 0.0 /100 | #316 | Tragic 46.8% |
| Immigrants | Haiti | 0.0 /100 | #317 | Tragic 46.5% |
| Immigrants | Albania | 0.0 /100 | #318 | Tragic 46.0% |
| Jamaicans | 0.0 /100 | #319 | Tragic 45.8% |
| Soviet Union | 0.0 /100 | #320 | Tragic 45.7% |
| Immigrants | Jamaica | 0.0 /100 | #321 | Tragic 44.5% |
| Senegalese | 0.0 /100 | #322 | Tragic 44.2% |
| Immigrants | Caribbean | 0.0 /100 | #323 | Tragic 44.2% |
| Immigrants | Cabo Verde | 0.0 /100 | #324 | Tragic 43.3% |
| Immigrants | West Indies | 0.0 /100 | #325 | Tragic 43.1% |
| Immigrants | Senegal | 0.0 /100 | #326 | Tragic 43.0% |
| Immigrants | Yemen | 0.0 /100 | #327 | Tragic 42.8% |
Demographics Similar to Immigrants from Somalia by 2 or more Vehicles in Household
In terms of 2 or more vehicles in household, the demographic groups most similar to Immigrants from Somalia are Cypriot (50.6%, a difference of 0.040%), Bermudan (50.6%, a difference of 0.11%), Immigrants from Spain (50.4%, a difference of 0.27%), Paraguayan (50.3%, a difference of 0.40%), and Immigrants from Morocco (50.3%, a difference of 0.43%).
| Demographics | Rating | Rank | 2 or more Vehicles in Household |
| Somalis | 0.0 /100 | #289 | Tragic 51.1% |
| Immigrants | Panama | 0.0 /100 | #290 | Tragic 51.1% |
| Belizeans | 0.0 /100 | #291 | Tragic 51.0% |
| Immigrants | Ukraine | 0.0 /100 | #292 | Tragic 50.9% |
| Blacks/African Americans | 0.0 /100 | #293 | Tragic 50.9% |
| Bermudans | 0.0 /100 | #294 | Tragic 50.6% |
| Cypriots | 0.0 /100 | #295 | Tragic 50.6% |
| Immigrants | Somalia | 0.0 /100 | #296 | Tragic 50.5% |
| Immigrants | Spain | 0.0 /100 | #297 | Tragic 50.4% |
| Paraguayans | 0.0 /100 | #298 | Tragic 50.3% |
| Immigrants | Morocco | 0.0 /100 | #299 | Tragic 50.3% |
| Immigrants | Russia | 0.0 /100 | #300 | Tragic 50.3% |
| Immigrants | Greece | 0.0 /100 | #301 | Tragic 50.2% |
| Immigrants | South America | 0.0 /100 | #302 | Tragic 50.2% |
| Tohono O'odham | 0.0 /100 | #303 | Tragic 50.0% |