Soviet Union vs Immigrants from Central America 2 or more Vehicles in Household
COMPARE
Soviet Union
Immigrants from Central America
2 or more Vehicles in Household
2 or more Vehicles in Household Comparison
Soviet Union
Immigrants from Central America
45.7%
2 OR MORE VEHICLES IN HOUSEHOLD
0.0/ 100
METRIC RATING
320th/ 347
METRIC RANK
58.6%
2 OR MORE VEHICLES IN HOUSEHOLD
99.7/ 100
METRIC RATING
65th/ 347
METRIC RANK
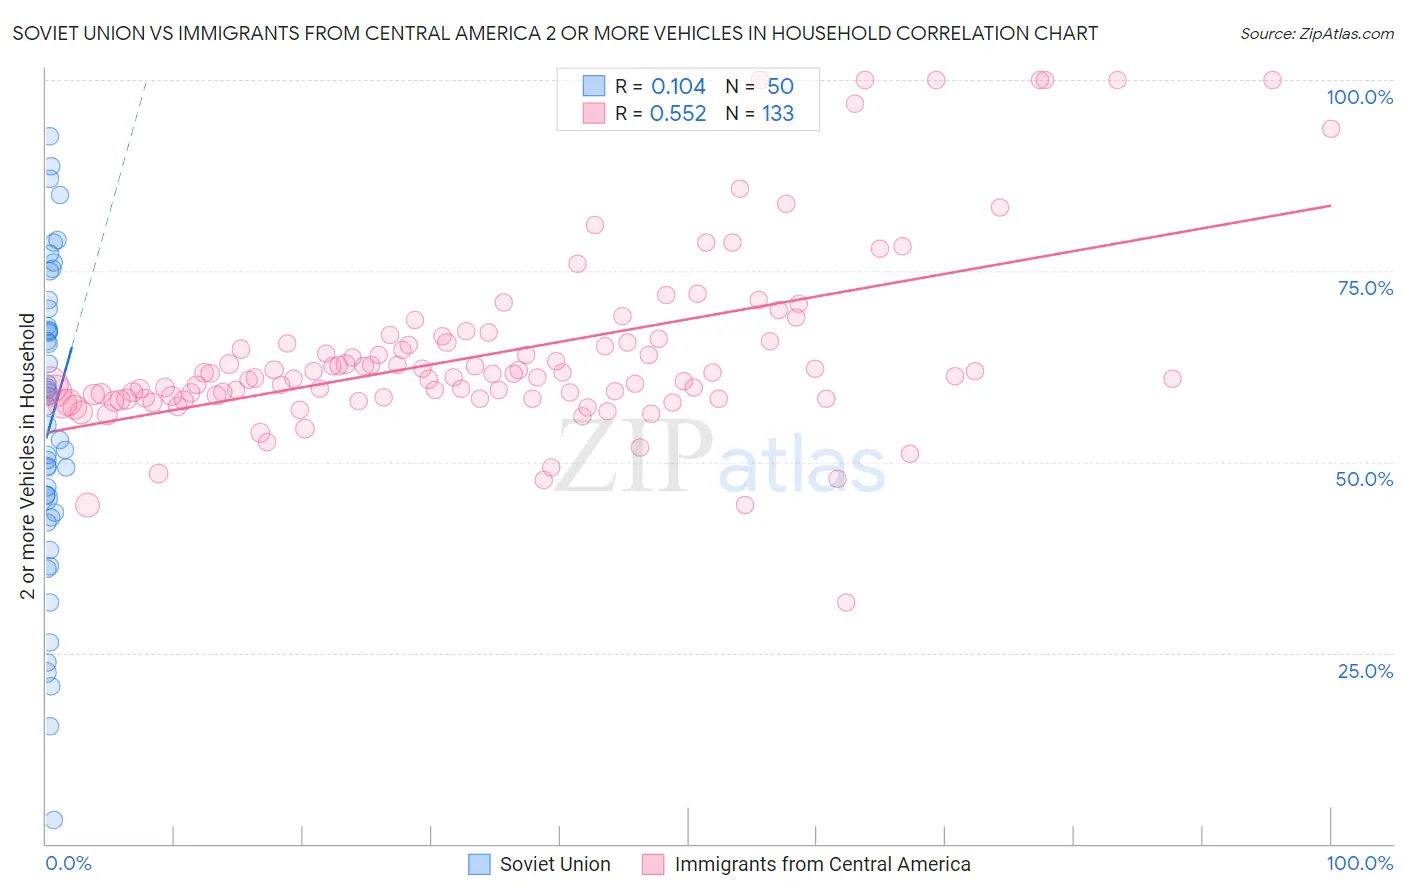
Soviet Union vs Immigrants from Central America 2 or more Vehicles in Household Correlation Chart
The statistical analysis conducted on geographies consisting of 43,509,630 people shows a poor positive correlation between the proportion of Soviet Union and percentage of households with 2 or more vehicles available in the United States with a correlation coefficient (R) of 0.104 and weighted average of 45.7%. Similarly, the statistical analysis conducted on geographies consisting of 536,122,766 people shows a substantial positive correlation between the proportion of Immigrants from Central America and percentage of households with 2 or more vehicles available in the United States with a correlation coefficient (R) of 0.552 and weighted average of 58.6%, a difference of 28.1%.
2 or more Vehicles in Household Correlation Summary
| Measurement | Soviet Union | Immigrants from Central America |
| Minimum | 3.0% | 31.6% |
| Maximum | 92.6% | 100.0% |
| Range | 89.6% | 68.4% |
| Mean | 54.9% | 64.2% |
| Median | 56.1% | 61.2% |
| Interquartile 25% (IQ1) | 43.4% | 58.3% |
| Interquartile 75% (IQ3) | 67.8% | 65.7% |
| Interquartile Range (IQR) | 24.4% | 7.4% |
| Standard Deviation (Sample) | 20.0% | 12.0% |
| Standard Deviation (Population) | 19.8% | 12.0% |
Similar Demographics by 2 or more Vehicles in Household
Demographics Similar to Soviet Union by 2 or more Vehicles in Household
In terms of 2 or more vehicles in household, the demographic groups most similar to Soviet Union are Jamaican (45.8%, a difference of 0.060%), Immigrants from Albania (46.0%, a difference of 0.58%), Immigrants from Haiti (46.5%, a difference of 1.7%), Cape Verdean (46.8%, a difference of 2.3%), and Immigrants from Jamaica (44.5%, a difference of 2.9%).
| Demographics | Rating | Rank | 2 or more Vehicles in Household |
| U.S. Virgin Islanders | 0.0 /100 | #313 | Tragic 47.5% |
| Immigrants | Ghana | 0.0 /100 | #314 | Tragic 47.4% |
| Puerto Ricans | 0.0 /100 | #315 | Tragic 47.1% |
| Cape Verdeans | 0.0 /100 | #316 | Tragic 46.8% |
| Immigrants | Haiti | 0.0 /100 | #317 | Tragic 46.5% |
| Immigrants | Albania | 0.0 /100 | #318 | Tragic 46.0% |
| Jamaicans | 0.0 /100 | #319 | Tragic 45.8% |
| Soviet Union | 0.0 /100 | #320 | Tragic 45.7% |
| Immigrants | Jamaica | 0.0 /100 | #321 | Tragic 44.5% |
| Senegalese | 0.0 /100 | #322 | Tragic 44.2% |
| Immigrants | Caribbean | 0.0 /100 | #323 | Tragic 44.2% |
| Immigrants | Cabo Verde | 0.0 /100 | #324 | Tragic 43.3% |
| Immigrants | West Indies | 0.0 /100 | #325 | Tragic 43.1% |
| Immigrants | Senegal | 0.0 /100 | #326 | Tragic 43.0% |
| Immigrants | Yemen | 0.0 /100 | #327 | Tragic 42.8% |
Demographics Similar to Immigrants from Central America by 2 or more Vehicles in Household
In terms of 2 or more vehicles in household, the demographic groups most similar to Immigrants from Central America are Croatian (58.6%, a difference of 0.010%), Laotian (58.6%, a difference of 0.020%), Canadian (58.6%, a difference of 0.040%), Portuguese (58.6%, a difference of 0.050%), and Pennsylvania German (58.5%, a difference of 0.16%).
| Demographics | Rating | Rank | 2 or more Vehicles in Household |
| Immigrants | Scotland | 99.8 /100 | #58 | Exceptional 58.9% |
| Spanish Americans | 99.8 /100 | #59 | Exceptional 58.9% |
| French Canadians | 99.8 /100 | #60 | Exceptional 58.9% |
| Osage | 99.8 /100 | #61 | Exceptional 58.8% |
| Immigrants | Nonimmigrants | 99.8 /100 | #62 | Exceptional 58.8% |
| Mexican American Indians | 99.8 /100 | #63 | Exceptional 58.7% |
| Portuguese | 99.7 /100 | #64 | Exceptional 58.6% |
| Immigrants | Central America | 99.7 /100 | #65 | Exceptional 58.6% |
| Croatians | 99.7 /100 | #66 | Exceptional 58.6% |
| Laotians | 99.7 /100 | #67 | Exceptional 58.6% |
| Canadians | 99.7 /100 | #68 | Exceptional 58.6% |
| Pennsylvania Germans | 99.7 /100 | #69 | Exceptional 58.5% |
| Italians | 99.6 /100 | #70 | Exceptional 58.4% |
| Bangladeshis | 99.6 /100 | #71 | Exceptional 58.4% |
| Austrians | 99.6 /100 | #72 | Exceptional 58.4% |