Soviet Union vs Immigrants from Europe 2 or more Vehicles in Household
COMPARE
Soviet Union
Immigrants from Europe
2 or more Vehicles in Household
2 or more Vehicles in Household Comparison
Soviet Union
Immigrants from Europe
45.7%
2 OR MORE VEHICLES IN HOUSEHOLD
0.0/ 100
METRIC RATING
320th/ 347
METRIC RANK
53.2%
2 OR MORE VEHICLES IN HOUSEHOLD
2.1/ 100
METRIC RATING
240th/ 347
METRIC RANK
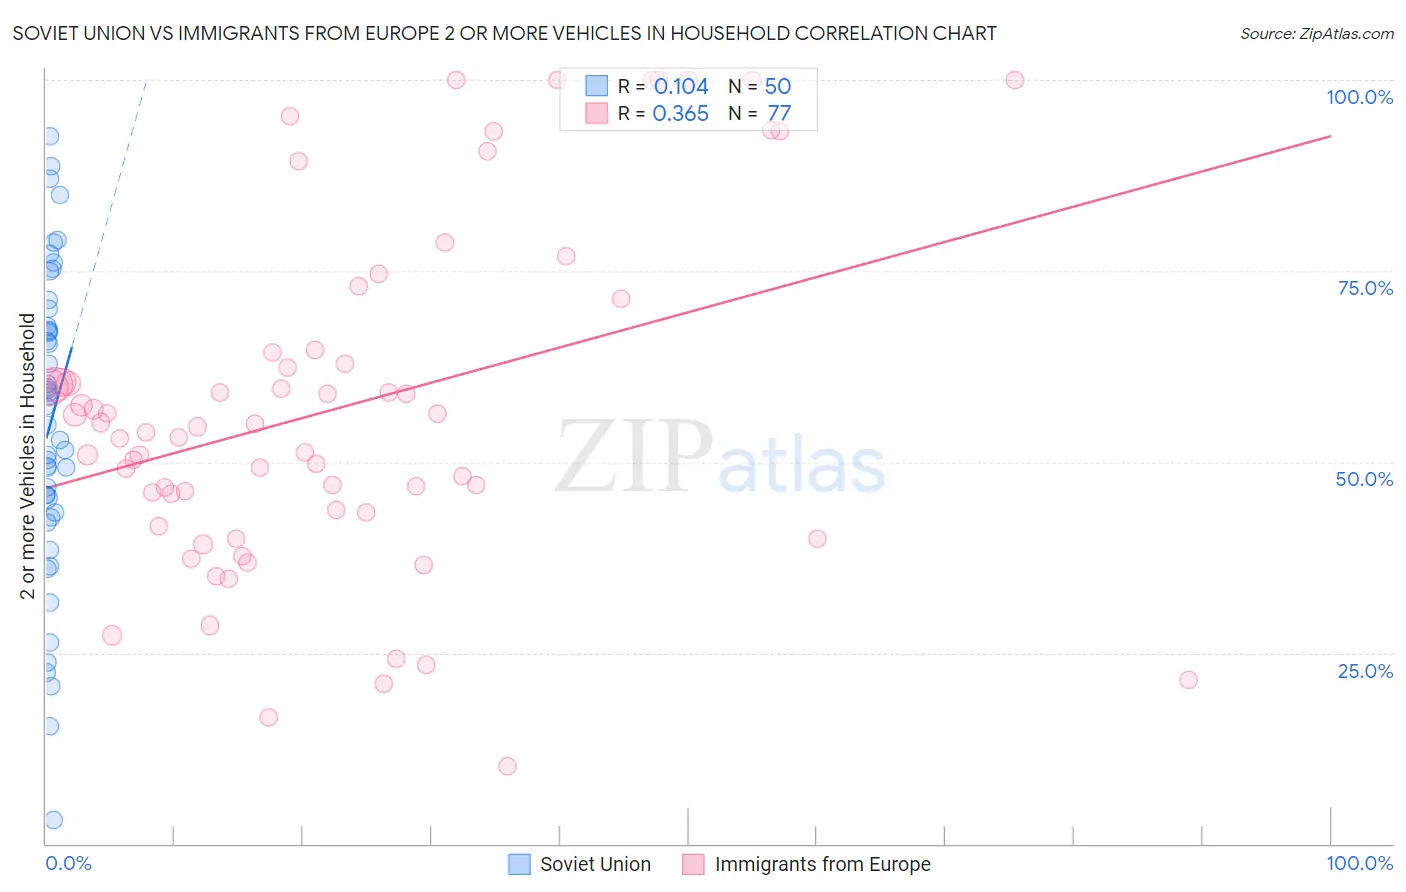
Soviet Union vs Immigrants from Europe 2 or more Vehicles in Household Correlation Chart
The statistical analysis conducted on geographies consisting of 43,509,630 people shows a poor positive correlation between the proportion of Soviet Union and percentage of households with 2 or more vehicles available in the United States with a correlation coefficient (R) of 0.104 and weighted average of 45.7%. Similarly, the statistical analysis conducted on geographies consisting of 546,948,405 people shows a mild positive correlation between the proportion of Immigrants from Europe and percentage of households with 2 or more vehicles available in the United States with a correlation coefficient (R) of 0.365 and weighted average of 53.2%, a difference of 16.4%.
2 or more Vehicles in Household Correlation Summary
| Measurement | Soviet Union | Immigrants from Europe |
| Minimum | 3.0% | 10.1% |
| Maximum | 92.6% | 100.0% |
| Range | 89.6% | 89.9% |
| Mean | 54.9% | 57.0% |
| Median | 56.1% | 54.6% |
| Interquartile 25% (IQ1) | 43.4% | 43.6% |
| Interquartile 75% (IQ3) | 67.8% | 64.5% |
| Interquartile Range (IQR) | 24.4% | 20.9% |
| Standard Deviation (Sample) | 20.0% | 22.4% |
| Standard Deviation (Population) | 19.8% | 22.2% |
Similar Demographics by 2 or more Vehicles in Household
Demographics Similar to Soviet Union by 2 or more Vehicles in Household
In terms of 2 or more vehicles in household, the demographic groups most similar to Soviet Union are Jamaican (45.8%, a difference of 0.060%), Immigrants from Albania (46.0%, a difference of 0.58%), Immigrants from Haiti (46.5%, a difference of 1.7%), Cape Verdean (46.8%, a difference of 2.3%), and Immigrants from Jamaica (44.5%, a difference of 2.9%).
| Demographics | Rating | Rank | 2 or more Vehicles in Household |
| U.S. Virgin Islanders | 0.0 /100 | #313 | Tragic 47.5% |
| Immigrants | Ghana | 0.0 /100 | #314 | Tragic 47.4% |
| Puerto Ricans | 0.0 /100 | #315 | Tragic 47.1% |
| Cape Verdeans | 0.0 /100 | #316 | Tragic 46.8% |
| Immigrants | Haiti | 0.0 /100 | #317 | Tragic 46.5% |
| Immigrants | Albania | 0.0 /100 | #318 | Tragic 46.0% |
| Jamaicans | 0.0 /100 | #319 | Tragic 45.8% |
| Soviet Union | 0.0 /100 | #320 | Tragic 45.7% |
| Immigrants | Jamaica | 0.0 /100 | #321 | Tragic 44.5% |
| Senegalese | 0.0 /100 | #322 | Tragic 44.2% |
| Immigrants | Caribbean | 0.0 /100 | #323 | Tragic 44.2% |
| Immigrants | Cabo Verde | 0.0 /100 | #324 | Tragic 43.3% |
| Immigrants | West Indies | 0.0 /100 | #325 | Tragic 43.1% |
| Immigrants | Senegal | 0.0 /100 | #326 | Tragic 43.0% |
| Immigrants | Yemen | 0.0 /100 | #327 | Tragic 42.8% |
Demographics Similar to Immigrants from Europe by 2 or more Vehicles in Household
In terms of 2 or more vehicles in household, the demographic groups most similar to Immigrants from Europe are Immigrants from Sierra Leone (53.2%, a difference of 0.030%), Immigrants from Eastern Asia (53.2%, a difference of 0.030%), Immigrants from Armenia (53.3%, a difference of 0.070%), Cambodian (53.3%, a difference of 0.070%), and Macedonian (53.3%, a difference of 0.14%).
| Demographics | Rating | Rank | 2 or more Vehicles in Household |
| Ugandans | 3.2 /100 | #233 | Tragic 53.5% |
| Immigrants | Switzerland | 3.0 /100 | #234 | Tragic 53.4% |
| Immigrants | Middle Africa | 3.0 /100 | #235 | Tragic 53.4% |
| Indonesians | 2.7 /100 | #236 | Tragic 53.4% |
| Macedonians | 2.4 /100 | #237 | Tragic 53.3% |
| Immigrants | Armenia | 2.3 /100 | #238 | Tragic 53.3% |
| Cambodians | 2.3 /100 | #239 | Tragic 53.3% |
| Immigrants | Europe | 2.1 /100 | #240 | Tragic 53.2% |
| Immigrants | Sierra Leone | 2.1 /100 | #241 | Tragic 53.2% |
| Immigrants | Eastern Asia | 2.1 /100 | #242 | Tragic 53.2% |
| Ethiopians | 1.7 /100 | #243 | Tragic 53.1% |
| Indians (Asian) | 1.7 /100 | #244 | Tragic 53.1% |
| Immigrants | Ethiopia | 1.5 /100 | #245 | Tragic 53.0% |
| Immigrants | Nigeria | 1.2 /100 | #246 | Tragic 52.9% |
| Sierra Leoneans | 1.2 /100 | #247 | Tragic 52.9% |