Soviet Union vs Dutch 2 or more Vehicles in Household
COMPARE
Soviet Union
Dutch
2 or more Vehicles in Household
2 or more Vehicles in Household Comparison
Soviet Union
Dutch
45.7%
2 OR MORE VEHICLES IN HOUSEHOLD
0.0/ 100
METRIC RATING
320th/ 347
METRIC RANK
61.6%
2 OR MORE VEHICLES IN HOUSEHOLD
100.0/ 100
METRIC RATING
11th/ 347
METRIC RANK
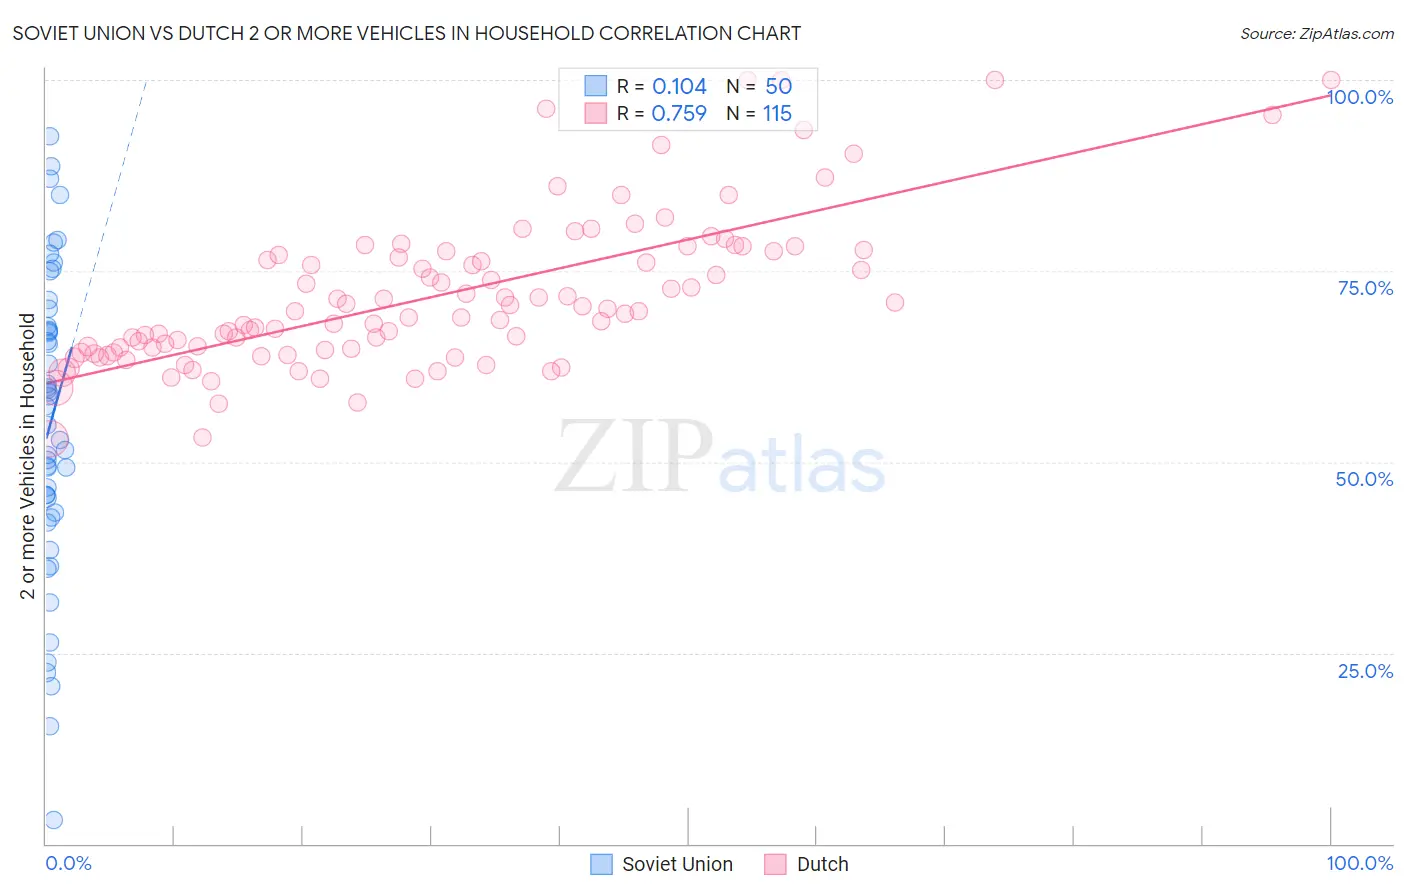
Soviet Union vs Dutch 2 or more Vehicles in Household Correlation Chart
The statistical analysis conducted on geographies consisting of 43,509,630 people shows a poor positive correlation between the proportion of Soviet Union and percentage of households with 2 or more vehicles available in the United States with a correlation coefficient (R) of 0.104 and weighted average of 45.7%. Similarly, the statistical analysis conducted on geographies consisting of 553,922,403 people shows a strong positive correlation between the proportion of Dutch and percentage of households with 2 or more vehicles available in the United States with a correlation coefficient (R) of 0.759 and weighted average of 61.6%, a difference of 34.8%.
2 or more Vehicles in Household Correlation Summary
| Measurement | Soviet Union | Dutch |
| Minimum | 3.0% | 53.0% |
| Maximum | 92.6% | 100.0% |
| Range | 89.6% | 47.0% |
| Mean | 54.9% | 71.8% |
| Median | 56.1% | 69.7% |
| Interquartile 25% (IQ1) | 43.4% | 64.7% |
| Interquartile 75% (IQ3) | 67.8% | 77.5% |
| Interquartile Range (IQR) | 24.4% | 12.8% |
| Standard Deviation (Sample) | 20.0% | 10.0% |
| Standard Deviation (Population) | 19.8% | 10.0% |
Similar Demographics by 2 or more Vehicles in Household
Demographics Similar to Soviet Union by 2 or more Vehicles in Household
In terms of 2 or more vehicles in household, the demographic groups most similar to Soviet Union are Jamaican (45.8%, a difference of 0.060%), Immigrants from Albania (46.0%, a difference of 0.58%), Immigrants from Haiti (46.5%, a difference of 1.7%), Cape Verdean (46.8%, a difference of 2.3%), and Immigrants from Jamaica (44.5%, a difference of 2.9%).
| Demographics | Rating | Rank | 2 or more Vehicles in Household |
| U.S. Virgin Islanders | 0.0 /100 | #313 | Tragic 47.5% |
| Immigrants | Ghana | 0.0 /100 | #314 | Tragic 47.4% |
| Puerto Ricans | 0.0 /100 | #315 | Tragic 47.1% |
| Cape Verdeans | 0.0 /100 | #316 | Tragic 46.8% |
| Immigrants | Haiti | 0.0 /100 | #317 | Tragic 46.5% |
| Immigrants | Albania | 0.0 /100 | #318 | Tragic 46.0% |
| Jamaicans | 0.0 /100 | #319 | Tragic 45.8% |
| Soviet Union | 0.0 /100 | #320 | Tragic 45.7% |
| Immigrants | Jamaica | 0.0 /100 | #321 | Tragic 44.5% |
| Senegalese | 0.0 /100 | #322 | Tragic 44.2% |
| Immigrants | Caribbean | 0.0 /100 | #323 | Tragic 44.2% |
| Immigrants | Cabo Verde | 0.0 /100 | #324 | Tragic 43.3% |
| Immigrants | West Indies | 0.0 /100 | #325 | Tragic 43.1% |
| Immigrants | Senegal | 0.0 /100 | #326 | Tragic 43.0% |
| Immigrants | Yemen | 0.0 /100 | #327 | Tragic 42.8% |
Demographics Similar to Dutch by 2 or more Vehicles in Household
In terms of 2 or more vehicles in household, the demographic groups most similar to Dutch are Mexican (61.7%, a difference of 0.050%), German (61.6%, a difference of 0.11%), Samoan (61.5%, a difference of 0.23%), Czech (61.5%, a difference of 0.28%), and Swedish (61.8%, a difference of 0.33%).
| Demographics | Rating | Rank | 2 or more Vehicles in Household |
| Norwegians | 100.0 /100 | #4 | Exceptional 62.8% |
| Immigrants | Fiji | 100.0 /100 | #5 | Exceptional 62.3% |
| Scandinavians | 100.0 /100 | #6 | Exceptional 62.1% |
| Puget Sound Salish | 100.0 /100 | #7 | Exceptional 62.1% |
| English | 100.0 /100 | #8 | Exceptional 61.9% |
| Swedes | 100.0 /100 | #9 | Exceptional 61.8% |
| Mexicans | 100.0 /100 | #10 | Exceptional 61.7% |
| Dutch | 100.0 /100 | #11 | Exceptional 61.6% |
| Germans | 100.0 /100 | #12 | Exceptional 61.6% |
| Samoans | 100.0 /100 | #13 | Exceptional 61.5% |
| Czechs | 100.0 /100 | #14 | Exceptional 61.5% |
| Nepalese | 100.0 /100 | #15 | Exceptional 61.4% |
| Native Hawaiians | 100.0 /100 | #16 | Exceptional 61.4% |
| Basques | 100.0 /100 | #17 | Exceptional 61.4% |
| Europeans | 100.0 /100 | #18 | Exceptional 61.4% |