Canadian vs Immigrants from Somalia 2 or more Vehicles in Household
COMPARE
Canadian
Immigrants from Somalia
2 or more Vehicles in Household
2 or more Vehicles in Household Comparison
Canadians
Immigrants from Somalia
58.6%
2 OR MORE VEHICLES IN HOUSEHOLD
99.7/ 100
METRIC RATING
68th/ 347
METRIC RANK
50.5%
2 OR MORE VEHICLES IN HOUSEHOLD
0.0/ 100
METRIC RATING
296th/ 347
METRIC RANK
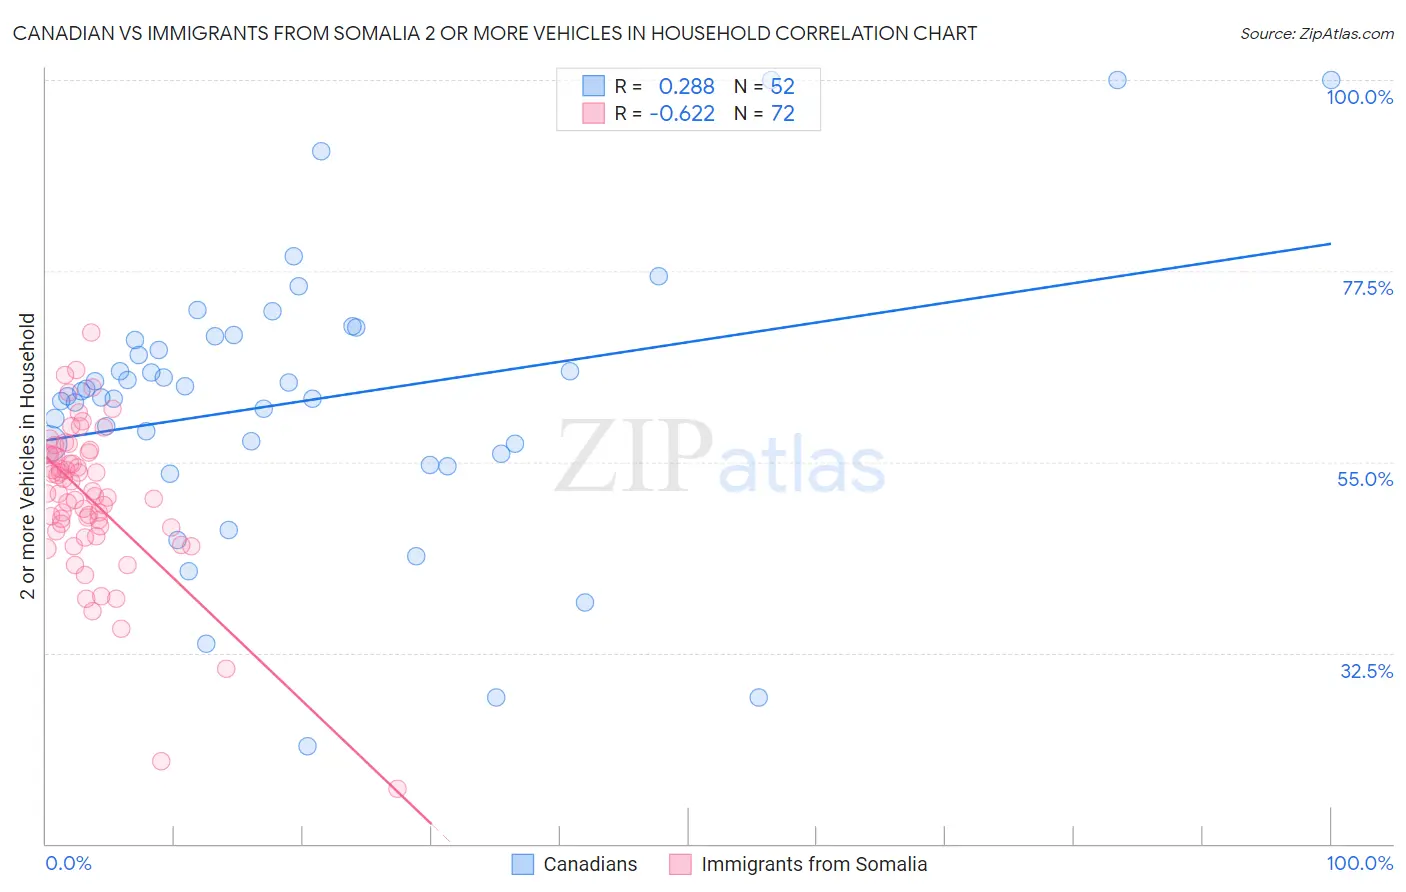
Canadian vs Immigrants from Somalia 2 or more Vehicles in Household Correlation Chart
The statistical analysis conducted on geographies consisting of 437,314,459 people shows a weak positive correlation between the proportion of Canadians and percentage of households with 2 or more vehicles available in the United States with a correlation coefficient (R) of 0.288 and weighted average of 58.6%. Similarly, the statistical analysis conducted on geographies consisting of 92,099,501 people shows a significant negative correlation between the proportion of Immigrants from Somalia and percentage of households with 2 or more vehicles available in the United States with a correlation coefficient (R) of -0.622 and weighted average of 50.5%, a difference of 15.9%.
2 or more Vehicles in Household Correlation Summary
| Measurement | Canadian | Immigrants from Somalia |
| Minimum | 21.4% | 16.4% |
| Maximum | 100.0% | 70.3% |
| Range | 78.6% | 53.8% |
| Mean | 62.2% | 50.6% |
| Median | 63.0% | 51.2% |
| Interquartile 25% (IQ1) | 56.5% | 47.1% |
| Interquartile 75% (IQ3) | 69.6% | 55.9% |
| Interquartile Range (IQR) | 13.0% | 8.8% |
| Standard Deviation (Sample) | 16.3% | 9.2% |
| Standard Deviation (Population) | 16.2% | 9.1% |
Similar Demographics by 2 or more Vehicles in Household
Demographics Similar to Canadians by 2 or more Vehicles in Household
In terms of 2 or more vehicles in household, the demographic groups most similar to Canadians are Laotian (58.6%, a difference of 0.010%), Croatian (58.6%, a difference of 0.030%), Immigrants from Central America (58.6%, a difference of 0.040%), Portuguese (58.6%, a difference of 0.090%), and Pennsylvania German (58.5%, a difference of 0.12%).
| Demographics | Rating | Rank | 2 or more Vehicles in Household |
| Osage | 99.8 /100 | #61 | Exceptional 58.8% |
| Immigrants | Nonimmigrants | 99.8 /100 | #62 | Exceptional 58.8% |
| Mexican American Indians | 99.8 /100 | #63 | Exceptional 58.7% |
| Portuguese | 99.7 /100 | #64 | Exceptional 58.6% |
| Immigrants | Central America | 99.7 /100 | #65 | Exceptional 58.6% |
| Croatians | 99.7 /100 | #66 | Exceptional 58.6% |
| Laotians | 99.7 /100 | #67 | Exceptional 58.6% |
| Canadians | 99.7 /100 | #68 | Exceptional 58.6% |
| Pennsylvania Germans | 99.7 /100 | #69 | Exceptional 58.5% |
| Italians | 99.6 /100 | #70 | Exceptional 58.4% |
| Bangladeshis | 99.6 /100 | #71 | Exceptional 58.4% |
| Austrians | 99.6 /100 | #72 | Exceptional 58.4% |
| Bolivians | 99.6 /100 | #73 | Exceptional 58.3% |
| Immigrants | Afghanistan | 99.6 /100 | #74 | Exceptional 58.3% |
| Poles | 99.5 /100 | #75 | Exceptional 58.3% |
Demographics Similar to Immigrants from Somalia by 2 or more Vehicles in Household
In terms of 2 or more vehicles in household, the demographic groups most similar to Immigrants from Somalia are Cypriot (50.6%, a difference of 0.040%), Bermudan (50.6%, a difference of 0.11%), Immigrants from Spain (50.4%, a difference of 0.27%), Paraguayan (50.3%, a difference of 0.40%), and Immigrants from Morocco (50.3%, a difference of 0.43%).
| Demographics | Rating | Rank | 2 or more Vehicles in Household |
| Somalis | 0.0 /100 | #289 | Tragic 51.1% |
| Immigrants | Panama | 0.0 /100 | #290 | Tragic 51.1% |
| Belizeans | 0.0 /100 | #291 | Tragic 51.0% |
| Immigrants | Ukraine | 0.0 /100 | #292 | Tragic 50.9% |
| Blacks/African Americans | 0.0 /100 | #293 | Tragic 50.9% |
| Bermudans | 0.0 /100 | #294 | Tragic 50.6% |
| Cypriots | 0.0 /100 | #295 | Tragic 50.6% |
| Immigrants | Somalia | 0.0 /100 | #296 | Tragic 50.5% |
| Immigrants | Spain | 0.0 /100 | #297 | Tragic 50.4% |
| Paraguayans | 0.0 /100 | #298 | Tragic 50.3% |
| Immigrants | Morocco | 0.0 /100 | #299 | Tragic 50.3% |
| Immigrants | Russia | 0.0 /100 | #300 | Tragic 50.3% |
| Immigrants | Greece | 0.0 /100 | #301 | Tragic 50.2% |
| Immigrants | South America | 0.0 /100 | #302 | Tragic 50.2% |
| Tohono O'odham | 0.0 /100 | #303 | Tragic 50.0% |