Immigrants from Austria vs Central American 2 or more Vehicles in Household
COMPARE
Immigrants from Austria
Central American
2 or more Vehicles in Household
2 or more Vehicles in Household Comparison
Immigrants from Austria
Central Americans
55.5%
2 OR MORE VEHICLES IN HOUSEHOLD
56.3/ 100
METRIC RATING
169th/ 347
METRIC RANK
54.7%
2 OR MORE VEHICLES IN HOUSEHOLD
23.0/ 100
METRIC RATING
194th/ 347
METRIC RANK
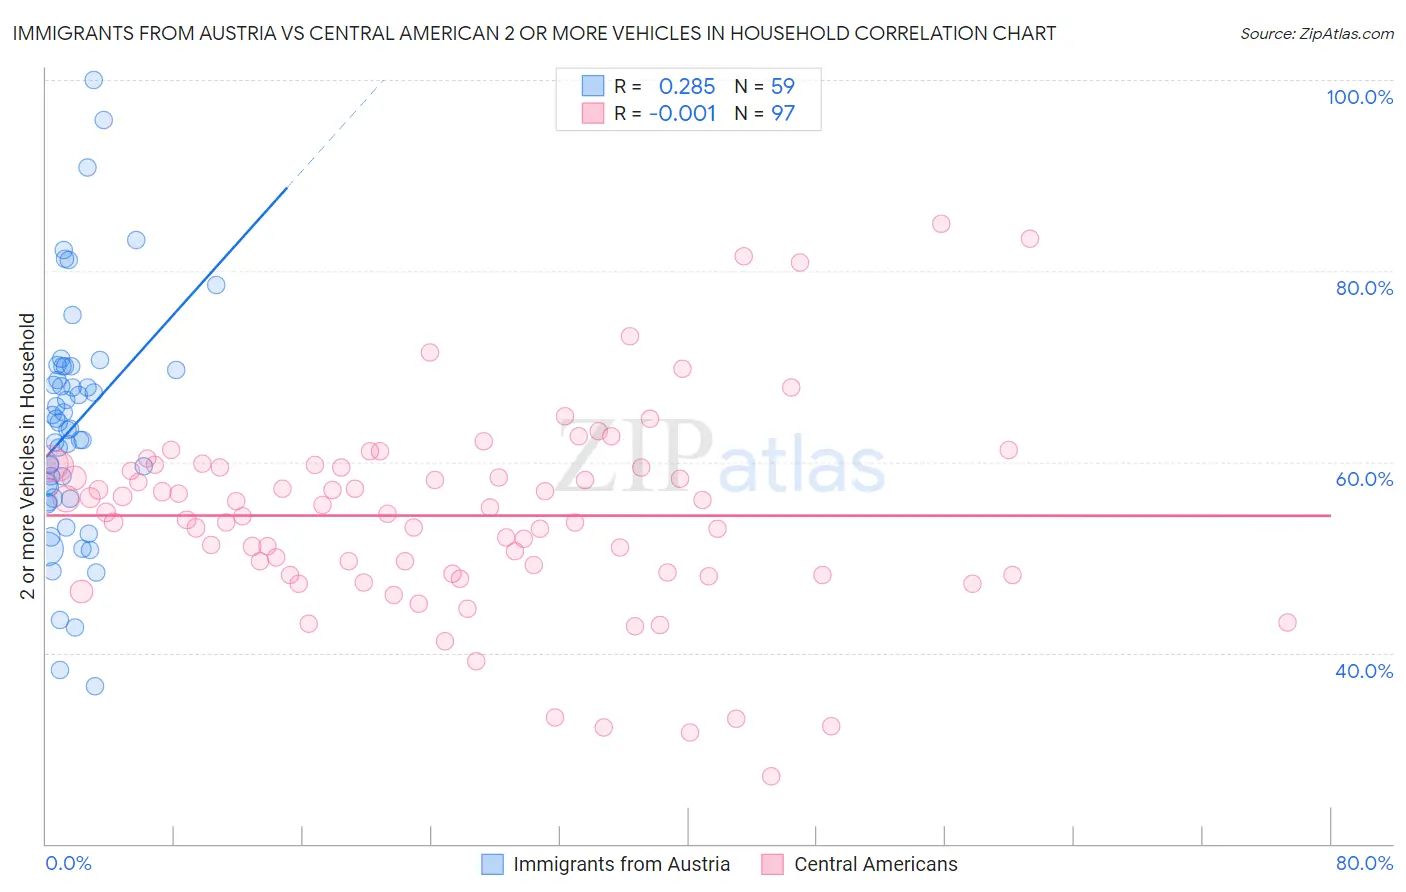
Immigrants from Austria vs Central American 2 or more Vehicles in Household Correlation Chart
The statistical analysis conducted on geographies consisting of 167,963,508 people shows a weak positive correlation between the proportion of Immigrants from Austria and percentage of households with 2 or more vehicles available in the United States with a correlation coefficient (R) of 0.285 and weighted average of 55.5%. Similarly, the statistical analysis conducted on geographies consisting of 504,126,351 people shows no correlation between the proportion of Central Americans and percentage of households with 2 or more vehicles available in the United States with a correlation coefficient (R) of -0.001 and weighted average of 54.7%, a difference of 1.5%.
2 or more Vehicles in Household Correlation Summary
| Measurement | Immigrants from Austria | Central American |
| Minimum | 36.4% | 27.0% |
| Maximum | 100.0% | 85.0% |
| Range | 63.6% | 58.0% |
| Mean | 63.8% | 54.4% |
| Median | 63.4% | 54.7% |
| Interquartile 25% (IQ1) | 56.1% | 48.2% |
| Interquartile 75% (IQ3) | 70.0% | 59.5% |
| Interquartile Range (IQR) | 13.9% | 11.3% |
| Standard Deviation (Sample) | 12.6% | 10.4% |
| Standard Deviation (Population) | 12.5% | 10.3% |
Similar Demographics by 2 or more Vehicles in Household
Demographics Similar to Immigrants from Austria by 2 or more Vehicles in Household
In terms of 2 or more vehicles in household, the demographic groups most similar to Immigrants from Austria are French American Indian (55.5%, a difference of 0.010%), Romanian (55.5%, a difference of 0.020%), Kenyan (55.5%, a difference of 0.070%), Immigrants from Sri Lanka (55.5%, a difference of 0.080%), and Immigrants from Costa Rica (55.4%, a difference of 0.080%).
| Demographics | Rating | Rank | 2 or more Vehicles in Household |
| German Russians | 60.9 /100 | #162 | Good 55.6% |
| Immigrants | Zimbabwe | 60.2 /100 | #163 | Good 55.6% |
| Dutch West Indians | 59.8 /100 | #164 | Average 55.6% |
| Immigrants | El Salvador | 59.4 /100 | #165 | Average 55.6% |
| Immigrants | Sri Lanka | 58.3 /100 | #166 | Average 55.5% |
| Kenyans | 58.1 /100 | #167 | Average 55.5% |
| French American Indians | 56.7 /100 | #168 | Average 55.5% |
| Immigrants | Austria | 56.3 /100 | #169 | Average 55.5% |
| Romanians | 55.8 /100 | #170 | Average 55.5% |
| Immigrants | Costa Rica | 54.4 /100 | #171 | Average 55.4% |
| Immigrants | Nicaragua | 51.6 /100 | #172 | Average 55.4% |
| Immigrants | Western Europe | 51.4 /100 | #173 | Average 55.4% |
| Navajo | 50.0 /100 | #174 | Average 55.3% |
| Immigrants | Denmark | 49.4 /100 | #175 | Average 55.3% |
| Immigrants | Cuba | 47.0 /100 | #176 | Average 55.3% |
Demographics Similar to Central Americans by 2 or more Vehicles in Household
In terms of 2 or more vehicles in household, the demographic groups most similar to Central Americans are Immigrants from Japan (54.7%, a difference of 0.020%), Iroquois (54.7%, a difference of 0.030%), Immigrants from Romania (54.7%, a difference of 0.050%), Immigrants (54.7%, a difference of 0.11%), and Russian (54.8%, a difference of 0.18%).
| Demographics | Rating | Rank | 2 or more Vehicles in Household |
| Immigrants | Uganda | 33.4 /100 | #187 | Fair 55.0% |
| Marshallese | 30.5 /100 | #188 | Fair 54.9% |
| Eastern Europeans | 27.5 /100 | #189 | Fair 54.8% |
| Russians | 26.3 /100 | #190 | Fair 54.8% |
| Immigrants | Immigrants | 25.0 /100 | #191 | Fair 54.7% |
| Immigrants | Romania | 23.8 /100 | #192 | Fair 54.7% |
| Immigrants | Japan | 23.4 /100 | #193 | Fair 54.7% |
| Central Americans | 23.0 /100 | #194 | Fair 54.7% |
| Iroquois | 22.6 /100 | #195 | Fair 54.7% |
| Immigrants | Poland | 19.3 /100 | #196 | Poor 54.6% |
| Argentineans | 17.5 /100 | #197 | Poor 54.5% |
| Carpatho Rusyns | 16.2 /100 | #198 | Poor 54.4% |
| Immigrants | Norway | 15.9 /100 | #199 | Poor 54.4% |
| Houma | 15.8 /100 | #200 | Poor 54.4% |
| Immigrants | Italy | 15.5 /100 | #201 | Poor 54.4% |