Slavic vs Immigrants from Peru Female Disability
COMPARE
Slavic
Immigrants from Peru
Female Disability
Female Disability Comparison
Slavs
Immigrants from Peru
12.6%
FEMALE DISABILITY
3.8/ 100
METRIC RATING
237th/ 347
METRIC RANK
11.3%
FEMALE DISABILITY
99.9/ 100
METRIC RATING
52nd/ 347
METRIC RANK
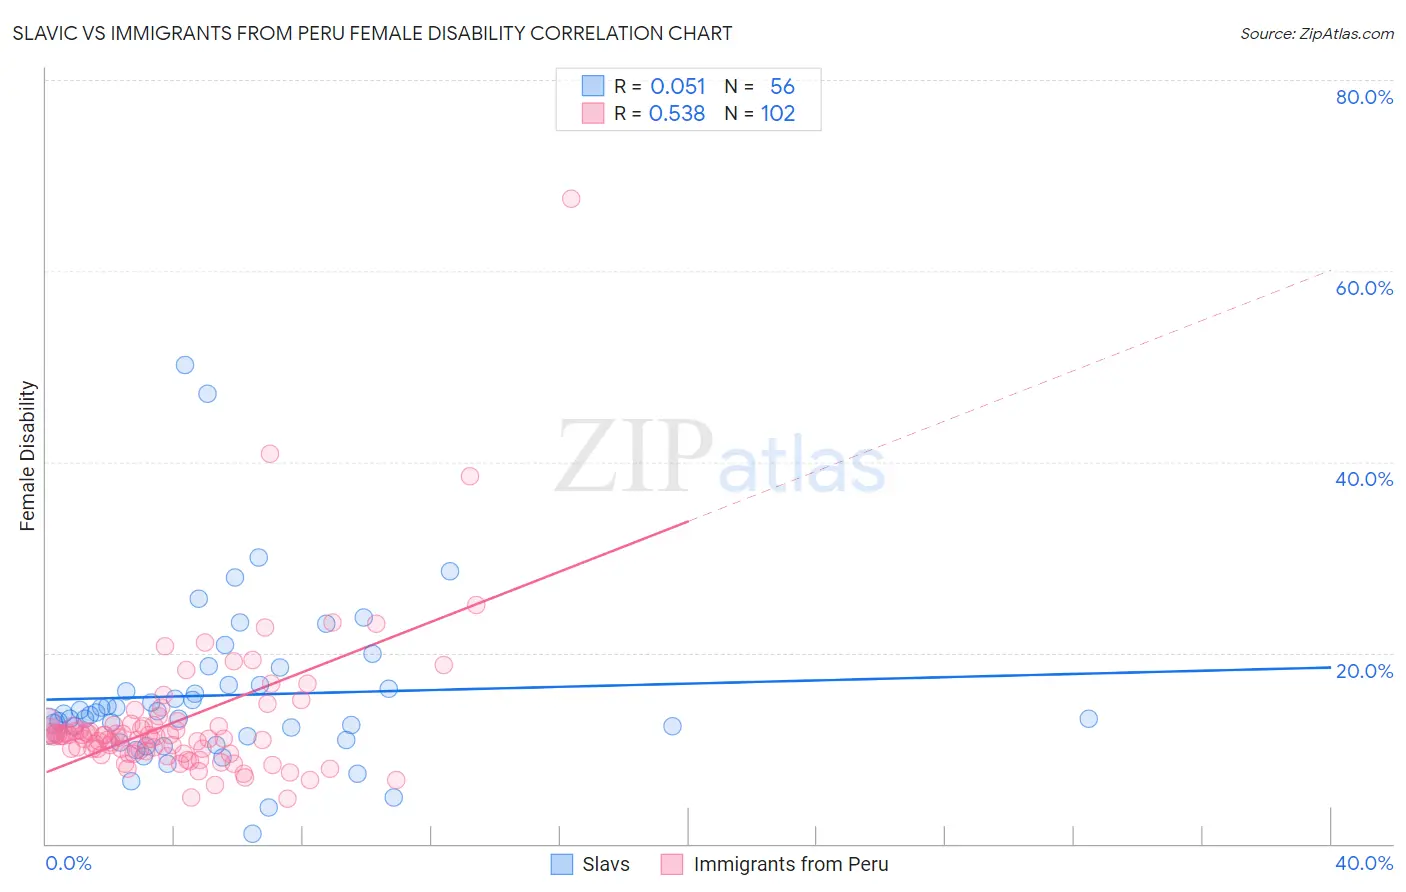
Slavic vs Immigrants from Peru Female Disability Correlation Chart
The statistical analysis conducted on geographies consisting of 270,849,330 people shows a slight positive correlation between the proportion of Slavs and percentage of females with a disability in the United States with a correlation coefficient (R) of 0.051 and weighted average of 12.6%. Similarly, the statistical analysis conducted on geographies consisting of 328,825,833 people shows a substantial positive correlation between the proportion of Immigrants from Peru and percentage of females with a disability in the United States with a correlation coefficient (R) of 0.538 and weighted average of 11.3%, a difference of 11.0%.
Female Disability Correlation Summary
| Measurement | Slavic | Immigrants from Peru |
| Minimum | 1.0% | 4.7% |
| Maximum | 50.2% | 67.6% |
| Range | 49.2% | 62.9% |
| Mean | 15.5% | 12.8% |
| Median | 13.5% | 11.3% |
| Interquartile 25% (IQ1) | 11.1% | 9.6% |
| Interquartile 75% (IQ3) | 16.6% | 12.4% |
| Interquartile Range (IQR) | 5.6% | 2.8% |
| Standard Deviation (Sample) | 8.7% | 7.7% |
| Standard Deviation (Population) | 8.6% | 7.7% |
Similar Demographics by Female Disability
Demographics Similar to Slavs by Female Disability
In terms of female disability, the demographic groups most similar to Slavs are Yugoslavian (12.6%, a difference of 0.030%), Barbadian (12.6%, a difference of 0.060%), Immigrants from West Indies (12.6%, a difference of 0.13%), German Russian (12.6%, a difference of 0.15%), and Malaysian (12.5%, a difference of 0.26%).
| Demographics | Rating | Rank | Female Disability |
| Immigrants | Belize | 7.0 /100 | #230 | Tragic 12.5% |
| Belgians | 6.5 /100 | #231 | Tragic 12.5% |
| Immigrants | Somalia | 5.9 /100 | #232 | Tragic 12.5% |
| Immigrants | Iraq | 5.3 /100 | #233 | Tragic 12.5% |
| Scandinavians | 5.3 /100 | #234 | Tragic 12.5% |
| Malaysians | 5.0 /100 | #235 | Tragic 12.5% |
| Immigrants | West Indies | 4.4 /100 | #236 | Tragic 12.6% |
| Slavs | 3.8 /100 | #237 | Tragic 12.6% |
| Yugoslavians | 3.7 /100 | #238 | Tragic 12.6% |
| Barbadians | 3.6 /100 | #239 | Tragic 12.6% |
| German Russians | 3.2 /100 | #240 | Tragic 12.6% |
| Japanese | 2.7 /100 | #241 | Tragic 12.6% |
| Canadians | 2.6 /100 | #242 | Tragic 12.6% |
| Immigrants | Senegal | 2.5 /100 | #243 | Tragic 12.6% |
| Alsatians | 2.5 /100 | #244 | Tragic 12.6% |
Demographics Similar to Immigrants from Peru by Female Disability
In terms of female disability, the demographic groups most similar to Immigrants from Peru are Immigrants from Saudi Arabia (11.3%, a difference of 0.040%), Peruvian (11.3%, a difference of 0.10%), Immigrants from Belgium (11.3%, a difference of 0.12%), Bulgarian (11.3%, a difference of 0.12%), and Inupiat (11.3%, a difference of 0.20%).
| Demographics | Rating | Rank | Female Disability |
| Immigrants | Sweden | 100.0 /100 | #45 | Exceptional 11.3% |
| Immigrants | Nepal | 100.0 /100 | #46 | Exceptional 11.3% |
| Jordanians | 100.0 /100 | #47 | Exceptional 11.3% |
| Zimbabweans | 100.0 /100 | #48 | Exceptional 11.3% |
| Tongans | 100.0 /100 | #49 | Exceptional 11.3% |
| Inupiat | 100.0 /100 | #50 | Exceptional 11.3% |
| Immigrants | Belgium | 100.0 /100 | #51 | Exceptional 11.3% |
| Immigrants | Peru | 99.9 /100 | #52 | Exceptional 11.3% |
| Immigrants | Saudi Arabia | 99.9 /100 | #53 | Exceptional 11.3% |
| Peruvians | 99.9 /100 | #54 | Exceptional 11.3% |
| Bulgarians | 99.9 /100 | #55 | Exceptional 11.3% |
| Taiwanese | 99.9 /100 | #56 | Exceptional 11.4% |
| South Americans | 99.9 /100 | #57 | Exceptional 11.4% |
| Laotians | 99.9 /100 | #58 | Exceptional 11.4% |
| Immigrants | Spain | 99.9 /100 | #59 | Exceptional 11.4% |