Sioux vs Ukrainian 2 or more Vehicles in Household
COMPARE
Sioux
Ukrainian
2 or more Vehicles in Household
2 or more Vehicles in Household Comparison
Sioux
Ukrainians
56.8%
2 OR MORE VEHICLES IN HOUSEHOLD
93.8/ 100
METRIC RATING
121st/ 347
METRIC RANK
55.8%
2 OR MORE VEHICLES IN HOUSEHOLD
70.8/ 100
METRIC RATING
154th/ 347
METRIC RANK
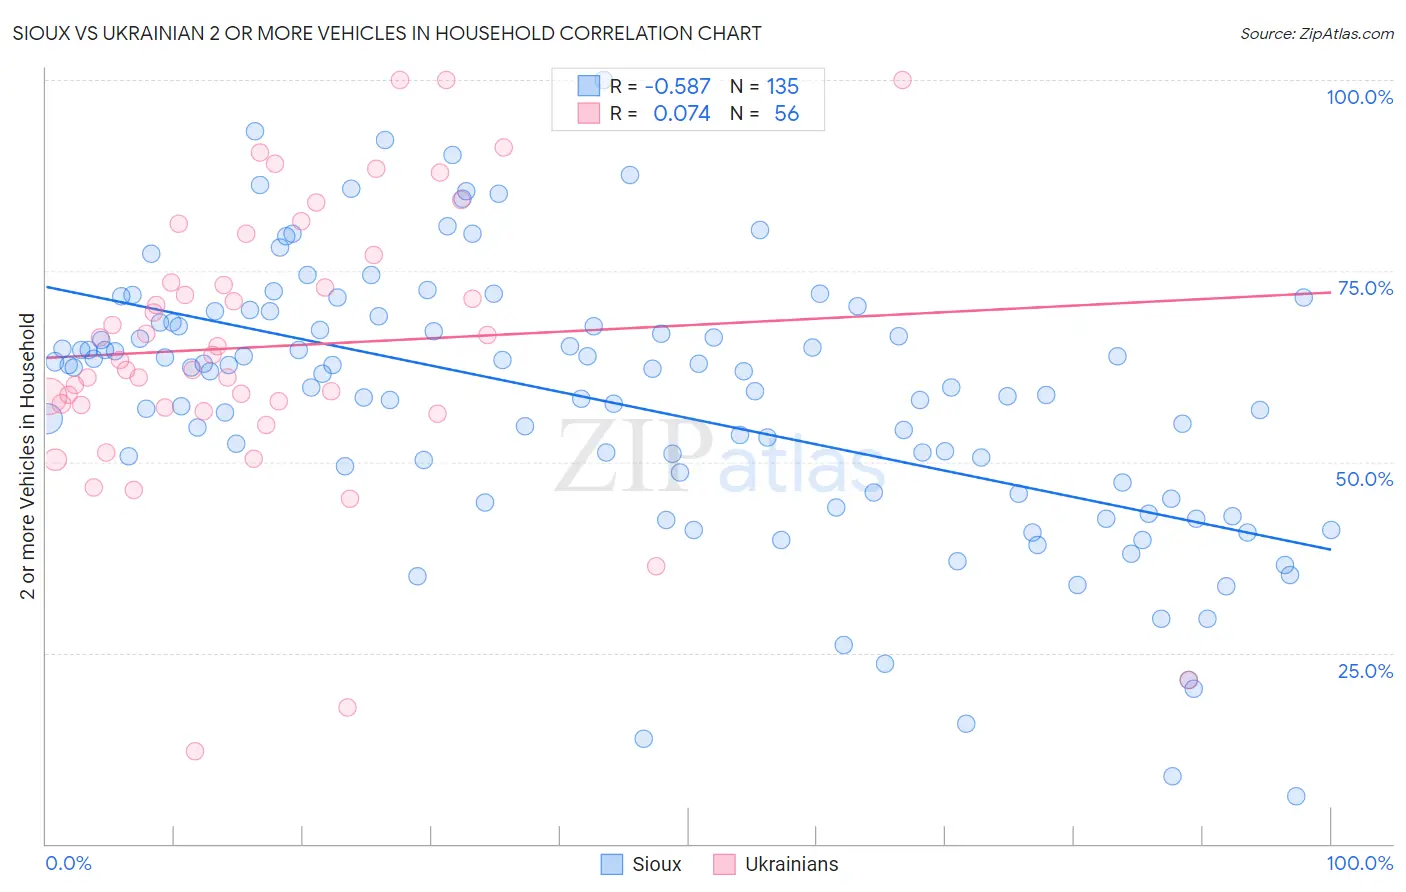
Sioux vs Ukrainian 2 or more Vehicles in Household Correlation Chart
The statistical analysis conducted on geographies consisting of 234,124,703 people shows a substantial negative correlation between the proportion of Sioux and percentage of households with 2 or more vehicles available in the United States with a correlation coefficient (R) of -0.587 and weighted average of 56.8%. Similarly, the statistical analysis conducted on geographies consisting of 448,366,334 people shows a slight positive correlation between the proportion of Ukrainians and percentage of households with 2 or more vehicles available in the United States with a correlation coefficient (R) of 0.074 and weighted average of 55.8%, a difference of 1.8%.
2 or more Vehicles in Household Correlation Summary
| Measurement | Sioux | Ukrainian |
| Minimum | 6.2% | 12.1% |
| Maximum | 100.0% | 100.0% |
| Range | 93.8% | 87.9% |
| Mean | 57.9% | 65.1% |
| Median | 61.8% | 63.7% |
| Interquartile 25% (IQ1) | 46.0% | 57.3% |
| Interquartile 75% (IQ3) | 68.2% | 75.2% |
| Interquartile Range (IQR) | 22.2% | 18.0% |
| Standard Deviation (Sample) | 17.6% | 18.5% |
| Standard Deviation (Population) | 17.5% | 18.3% |
Similar Demographics by 2 or more Vehicles in Household
Demographics Similar to Sioux by 2 or more Vehicles in Household
In terms of 2 or more vehicles in household, the demographic groups most similar to Sioux are Costa Rican (56.9%, a difference of 0.17%), Immigrants from South Africa (56.7%, a difference of 0.20%), Native/Alaskan (57.0%, a difference of 0.21%), Asian (57.0%, a difference of 0.24%), and Australian (56.7%, a difference of 0.29%).
| Demographics | Rating | Rank | 2 or more Vehicles in Household |
| Immigrants | Lebanon | 96.8 /100 | #114 | Exceptional 57.2% |
| Chippewa | 96.6 /100 | #115 | Exceptional 57.2% |
| Immigrants | Jordan | 96.6 /100 | #116 | Exceptional 57.2% |
| Iraqis | 95.8 /100 | #117 | Exceptional 57.1% |
| Asians | 95.1 /100 | #118 | Exceptional 57.0% |
| Natives/Alaskans | 95.0 /100 | #119 | Exceptional 57.0% |
| Costa Ricans | 94.7 /100 | #120 | Exceptional 56.9% |
| Sioux | 93.8 /100 | #121 | Exceptional 56.8% |
| Immigrants | South Africa | 92.5 /100 | #122 | Exceptional 56.7% |
| Australians | 91.8 /100 | #123 | Exceptional 56.7% |
| New Zealanders | 91.8 /100 | #124 | Exceptional 56.7% |
| Tsimshian | 91.6 /100 | #125 | Exceptional 56.7% |
| Estonians | 90.9 /100 | #126 | Exceptional 56.6% |
| Immigrants | Thailand | 90.7 /100 | #127 | Exceptional 56.6% |
| Immigrants | South Central Asia | 90.5 /100 | #128 | Exceptional 56.6% |
Demographics Similar to Ukrainians by 2 or more Vehicles in Household
In terms of 2 or more vehicles in household, the demographic groups most similar to Ukrainians are Immigrants from Venezuela (55.8%, a difference of 0.0%), Immigrants from Lithuania (55.8%, a difference of 0.020%), Immigrants from Kuwait (55.8%, a difference of 0.030%), Lumbee (55.9%, a difference of 0.060%), and Tlingit-Haida (55.8%, a difference of 0.10%).
| Demographics | Rating | Rank | 2 or more Vehicles in Household |
| Serbians | 80.3 /100 | #147 | Excellent 56.1% |
| Immigrants | Moldova | 80.2 /100 | #148 | Excellent 56.1% |
| Chileans | 80.2 /100 | #149 | Excellent 56.1% |
| Nicaraguans | 79.9 /100 | #150 | Good 56.1% |
| Immigrants | Northern Europe | 78.7 /100 | #151 | Good 56.1% |
| Immigrants | Pakistan | 78.1 /100 | #152 | Good 56.1% |
| Lumbee | 71.9 /100 | #153 | Good 55.9% |
| Ukrainians | 70.8 /100 | #154 | Good 55.8% |
| Immigrants | Venezuela | 70.7 /100 | #155 | Good 55.8% |
| Immigrants | Lithuania | 70.4 /100 | #156 | Good 55.8% |
| Immigrants | Kuwait | 70.2 /100 | #157 | Good 55.8% |
| Tlingit-Haida | 68.5 /100 | #158 | Good 55.8% |
| Paiute | 68.0 /100 | #159 | Good 55.8% |
| Crow | 67.0 /100 | #160 | Good 55.7% |
| Colville | 61.1 /100 | #161 | Good 55.6% |