Sioux vs Swiss 2 or more Vehicles in Household
COMPARE
Sioux
Swiss
2 or more Vehicles in Household
2 or more Vehicles in Household Comparison
Sioux
Swiss
56.8%
2 OR MORE VEHICLES IN HOUSEHOLD
93.8/ 100
METRIC RATING
121st/ 347
METRIC RANK
61.0%
2 OR MORE VEHICLES IN HOUSEHOLD
100.0/ 100
METRIC RATING
22nd/ 347
METRIC RANK
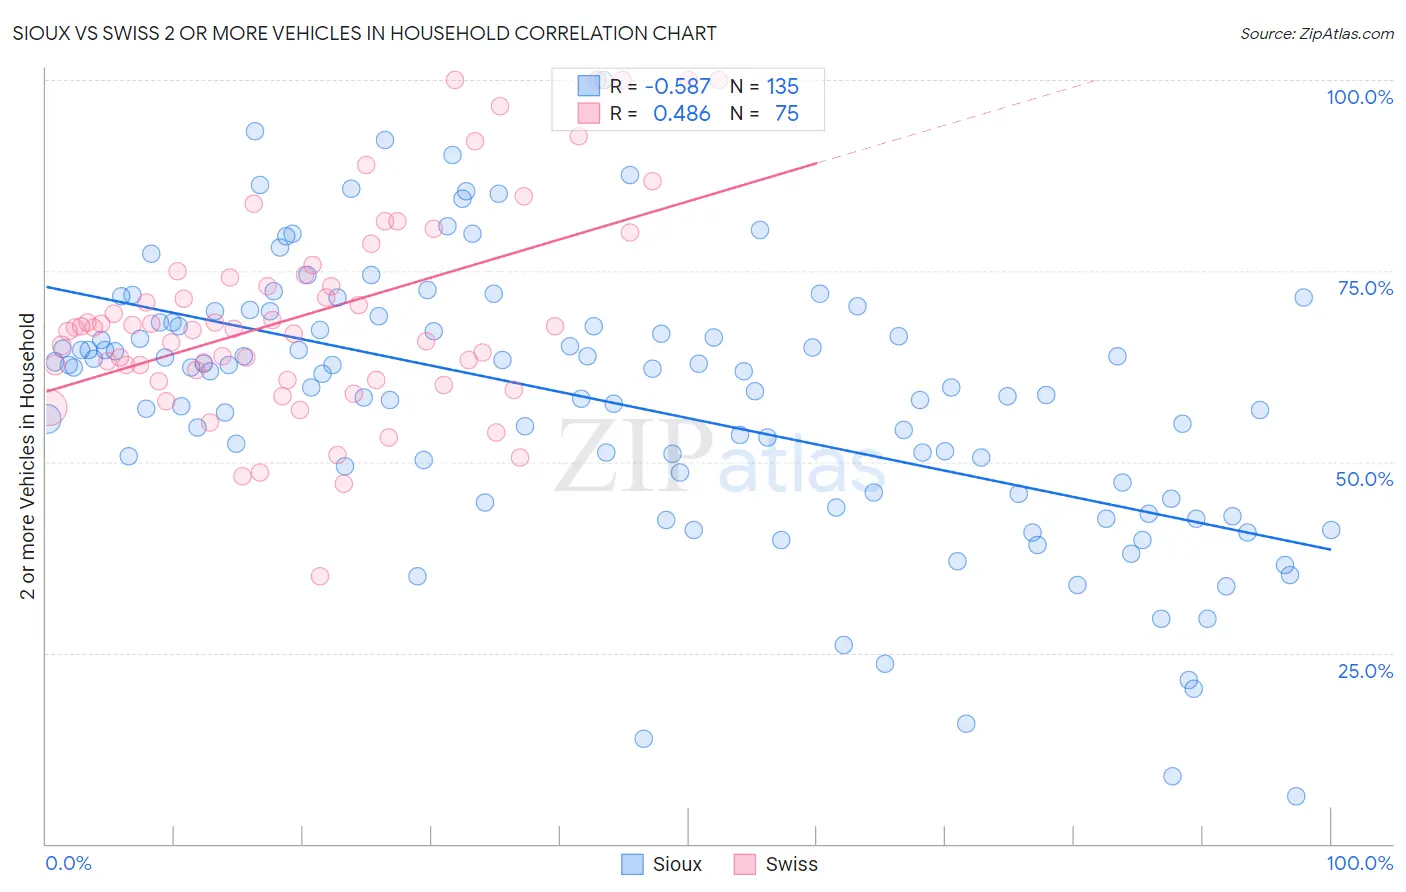
Sioux vs Swiss 2 or more Vehicles in Household Correlation Chart
The statistical analysis conducted on geographies consisting of 234,124,703 people shows a substantial negative correlation between the proportion of Sioux and percentage of households with 2 or more vehicles available in the United States with a correlation coefficient (R) of -0.587 and weighted average of 56.8%. Similarly, the statistical analysis conducted on geographies consisting of 464,799,641 people shows a moderate positive correlation between the proportion of Swiss and percentage of households with 2 or more vehicles available in the United States with a correlation coefficient (R) of 0.486 and weighted average of 61.0%, a difference of 7.3%.
2 or more Vehicles in Household Correlation Summary
| Measurement | Sioux | Swiss |
| Minimum | 6.2% | 35.0% |
| Maximum | 100.0% | 100.0% |
| Range | 93.8% | 65.0% |
| Mean | 57.9% | 69.3% |
| Median | 61.8% | 67.5% |
| Interquartile 25% (IQ1) | 46.0% | 60.8% |
| Interquartile 75% (IQ3) | 68.2% | 75.0% |
| Interquartile Range (IQR) | 22.2% | 14.2% |
| Standard Deviation (Sample) | 17.6% | 13.7% |
| Standard Deviation (Population) | 17.5% | 13.6% |
Similar Demographics by 2 or more Vehicles in Household
Demographics Similar to Sioux by 2 or more Vehicles in Household
In terms of 2 or more vehicles in household, the demographic groups most similar to Sioux are Costa Rican (56.9%, a difference of 0.17%), Immigrants from South Africa (56.7%, a difference of 0.20%), Native/Alaskan (57.0%, a difference of 0.21%), Asian (57.0%, a difference of 0.24%), and Australian (56.7%, a difference of 0.29%).
| Demographics | Rating | Rank | 2 or more Vehicles in Household |
| Immigrants | Lebanon | 96.8 /100 | #114 | Exceptional 57.2% |
| Chippewa | 96.6 /100 | #115 | Exceptional 57.2% |
| Immigrants | Jordan | 96.6 /100 | #116 | Exceptional 57.2% |
| Iraqis | 95.8 /100 | #117 | Exceptional 57.1% |
| Asians | 95.1 /100 | #118 | Exceptional 57.0% |
| Natives/Alaskans | 95.0 /100 | #119 | Exceptional 57.0% |
| Costa Ricans | 94.7 /100 | #120 | Exceptional 56.9% |
| Sioux | 93.8 /100 | #121 | Exceptional 56.8% |
| Immigrants | South Africa | 92.5 /100 | #122 | Exceptional 56.7% |
| Australians | 91.8 /100 | #123 | Exceptional 56.7% |
| New Zealanders | 91.8 /100 | #124 | Exceptional 56.7% |
| Tsimshian | 91.6 /100 | #125 | Exceptional 56.7% |
| Estonians | 90.9 /100 | #126 | Exceptional 56.6% |
| Immigrants | Thailand | 90.7 /100 | #127 | Exceptional 56.6% |
| Immigrants | South Central Asia | 90.5 /100 | #128 | Exceptional 56.6% |
Demographics Similar to Swiss by 2 or more Vehicles in Household
In terms of 2 or more vehicles in household, the demographic groups most similar to Swiss are Korean (61.0%, a difference of 0.040%), Scotch-Irish (60.9%, a difference of 0.040%), Immigrants from Vietnam (60.9%, a difference of 0.070%), Sri Lankan (61.0%, a difference of 0.080%), and White/Caucasian (60.8%, a difference of 0.23%).
| Demographics | Rating | Rank | 2 or more Vehicles in Household |
| Nepalese | 100.0 /100 | #15 | Exceptional 61.4% |
| Native Hawaiians | 100.0 /100 | #16 | Exceptional 61.4% |
| Basques | 100.0 /100 | #17 | Exceptional 61.4% |
| Europeans | 100.0 /100 | #18 | Exceptional 61.4% |
| Scottish | 100.0 /100 | #19 | Exceptional 61.2% |
| Sri Lankans | 100.0 /100 | #20 | Exceptional 61.0% |
| Koreans | 100.0 /100 | #21 | Exceptional 61.0% |
| Swiss | 100.0 /100 | #22 | Exceptional 61.0% |
| Scotch-Irish | 100.0 /100 | #23 | Exceptional 60.9% |
| Immigrants | Vietnam | 100.0 /100 | #24 | Exceptional 60.9% |
| Whites/Caucasians | 100.0 /100 | #25 | Exceptional 60.8% |
| Welsh | 100.0 /100 | #26 | Exceptional 60.8% |
| Assyrians/Chaldeans/Syriacs | 100.0 /100 | #27 | Exceptional 60.5% |
| Guamanians/Chamorros | 100.0 /100 | #28 | Exceptional 60.5% |
| Hawaiians | 100.0 /100 | #29 | Exceptional 60.4% |