Sioux vs Fijian 2 or more Vehicles in Household
COMPARE
Sioux
Fijian
2 or more Vehicles in Household
2 or more Vehicles in Household Comparison
Sioux
Fijians
56.8%
2 OR MORE VEHICLES IN HOUSEHOLD
93.8/ 100
METRIC RATING
121st/ 347
METRIC RANK
57.6%
2 OR MORE VEHICLES IN HOUSEHOLD
98.4/ 100
METRIC RATING
100th/ 347
METRIC RANK
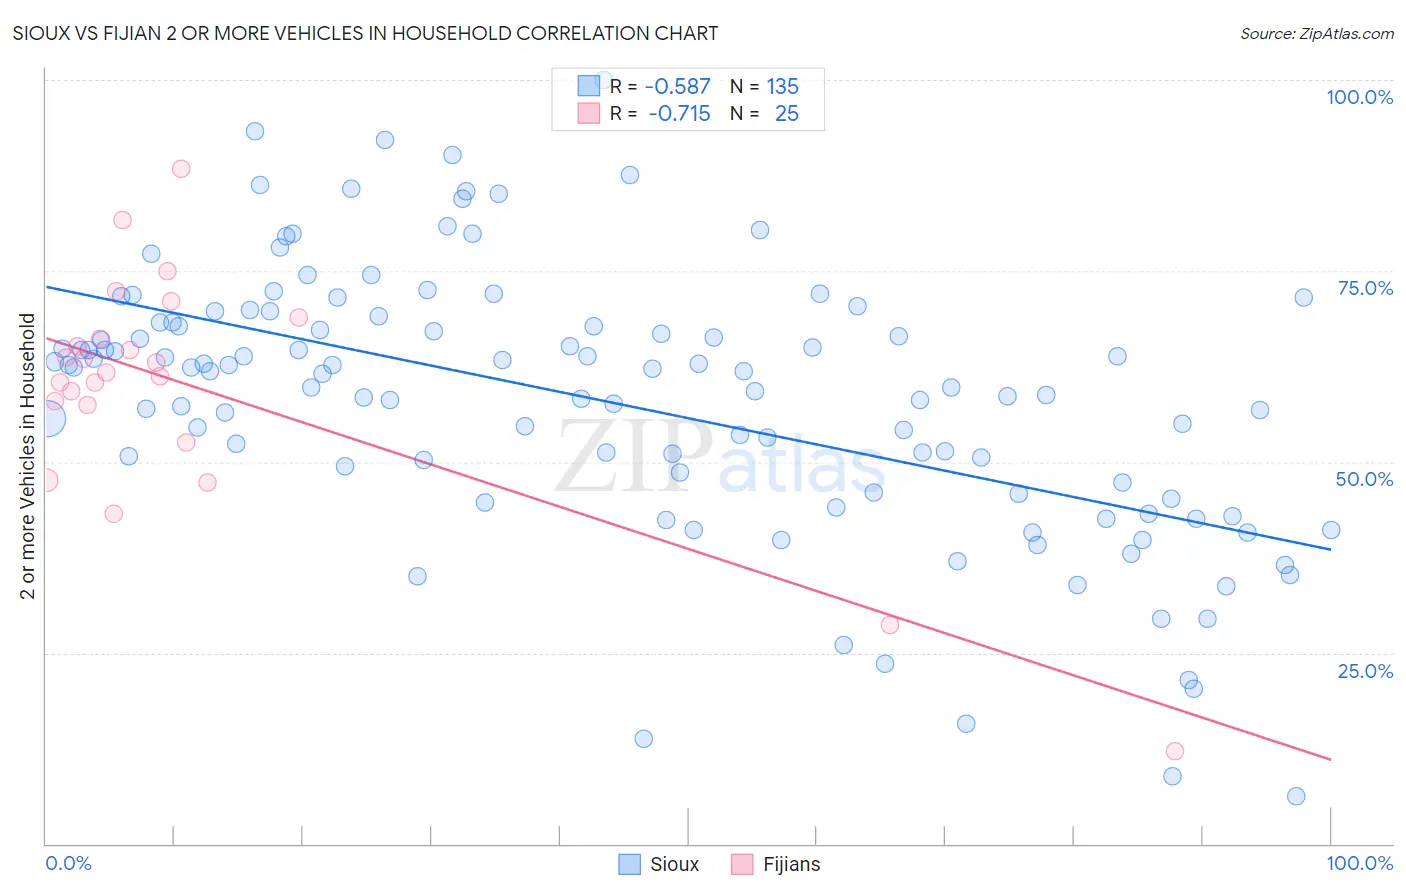
Sioux vs Fijian 2 or more Vehicles in Household Correlation Chart
The statistical analysis conducted on geographies consisting of 234,124,703 people shows a substantial negative correlation between the proportion of Sioux and percentage of households with 2 or more vehicles available in the United States with a correlation coefficient (R) of -0.587 and weighted average of 56.8%. Similarly, the statistical analysis conducted on geographies consisting of 55,948,040 people shows a strong negative correlation between the proportion of Fijians and percentage of households with 2 or more vehicles available in the United States with a correlation coefficient (R) of -0.715 and weighted average of 57.6%, a difference of 1.3%.
2 or more Vehicles in Household Correlation Summary
| Measurement | Sioux | Fijian |
| Minimum | 6.2% | 12.2% |
| Maximum | 100.0% | 88.4% |
| Range | 93.8% | 76.3% |
| Mean | 57.9% | 59.7% |
| Median | 61.8% | 61.6% |
| Interquartile 25% (IQ1) | 46.0% | 54.9% |
| Interquartile 75% (IQ3) | 68.2% | 67.6% |
| Interquartile Range (IQR) | 22.2% | 12.6% |
| Standard Deviation (Sample) | 17.6% | 15.7% |
| Standard Deviation (Population) | 17.5% | 15.4% |
Similar Demographics by 2 or more Vehicles in Household
Demographics Similar to Sioux by 2 or more Vehicles in Household
In terms of 2 or more vehicles in household, the demographic groups most similar to Sioux are Costa Rican (56.9%, a difference of 0.17%), Immigrants from South Africa (56.7%, a difference of 0.20%), Native/Alaskan (57.0%, a difference of 0.21%), Asian (57.0%, a difference of 0.24%), and Australian (56.7%, a difference of 0.29%).
| Demographics | Rating | Rank | 2 or more Vehicles in Household |
| Immigrants | Lebanon | 96.8 /100 | #114 | Exceptional 57.2% |
| Chippewa | 96.6 /100 | #115 | Exceptional 57.2% |
| Immigrants | Jordan | 96.6 /100 | #116 | Exceptional 57.2% |
| Iraqis | 95.8 /100 | #117 | Exceptional 57.1% |
| Asians | 95.1 /100 | #118 | Exceptional 57.0% |
| Natives/Alaskans | 95.0 /100 | #119 | Exceptional 57.0% |
| Costa Ricans | 94.7 /100 | #120 | Exceptional 56.9% |
| Sioux | 93.8 /100 | #121 | Exceptional 56.8% |
| Immigrants | South Africa | 92.5 /100 | #122 | Exceptional 56.7% |
| Australians | 91.8 /100 | #123 | Exceptional 56.7% |
| New Zealanders | 91.8 /100 | #124 | Exceptional 56.7% |
| Tsimshian | 91.6 /100 | #125 | Exceptional 56.7% |
| Estonians | 90.9 /100 | #126 | Exceptional 56.6% |
| Immigrants | Thailand | 90.7 /100 | #127 | Exceptional 56.6% |
| Immigrants | South Central Asia | 90.5 /100 | #128 | Exceptional 56.6% |
Demographics Similar to Fijians by 2 or more Vehicles in Household
In terms of 2 or more vehicles in household, the demographic groups most similar to Fijians are Lebanese (57.6%, a difference of 0.050%), Cajun (57.7%, a difference of 0.070%), Immigrants from Bolivia (57.6%, a difference of 0.090%), Jordanian (57.6%, a difference of 0.10%), and Immigrants from Indonesia (57.6%, a difference of 0.10%).
| Demographics | Rating | Rank | 2 or more Vehicles in Household |
| Ottawa | 99.0 /100 | #93 | Exceptional 57.9% |
| Filipinos | 98.9 /100 | #94 | Exceptional 57.8% |
| Hmong | 98.9 /100 | #95 | Exceptional 57.8% |
| Burmese | 98.8 /100 | #96 | Exceptional 57.8% |
| Slavs | 98.8 /100 | #97 | Exceptional 57.8% |
| Palestinians | 98.6 /100 | #98 | Exceptional 57.7% |
| Cajuns | 98.5 /100 | #99 | Exceptional 57.7% |
| Fijians | 98.4 /100 | #100 | Exceptional 57.6% |
| Lebanese | 98.3 /100 | #101 | Exceptional 57.6% |
| Immigrants | Bolivia | 98.2 /100 | #102 | Exceptional 57.6% |
| Jordanians | 98.2 /100 | #103 | Exceptional 57.6% |
| Immigrants | Indonesia | 98.2 /100 | #104 | Exceptional 57.6% |
| Immigrants | Korea | 98.2 /100 | #105 | Exceptional 57.6% |
| Immigrants | Oceania | 98.2 /100 | #106 | Exceptional 57.5% |
| Immigrants | Netherlands | 98.2 /100 | #107 | Exceptional 57.5% |