Shoshone vs Sudanese 1 or more Vehicles in Household
COMPARE
Shoshone
Sudanese
1 or more Vehicles in Household
1 or more Vehicles in Household Comparison
Shoshone
Sudanese
89.5%
1 OR MORE VEHICLES IN HOUSEHOLD
37.5/ 100
METRIC RATING
190th/ 347
METRIC RANK
90.3%
1 OR MORE VEHICLES IN HOUSEHOLD
85.2/ 100
METRIC RATING
140th/ 347
METRIC RANK
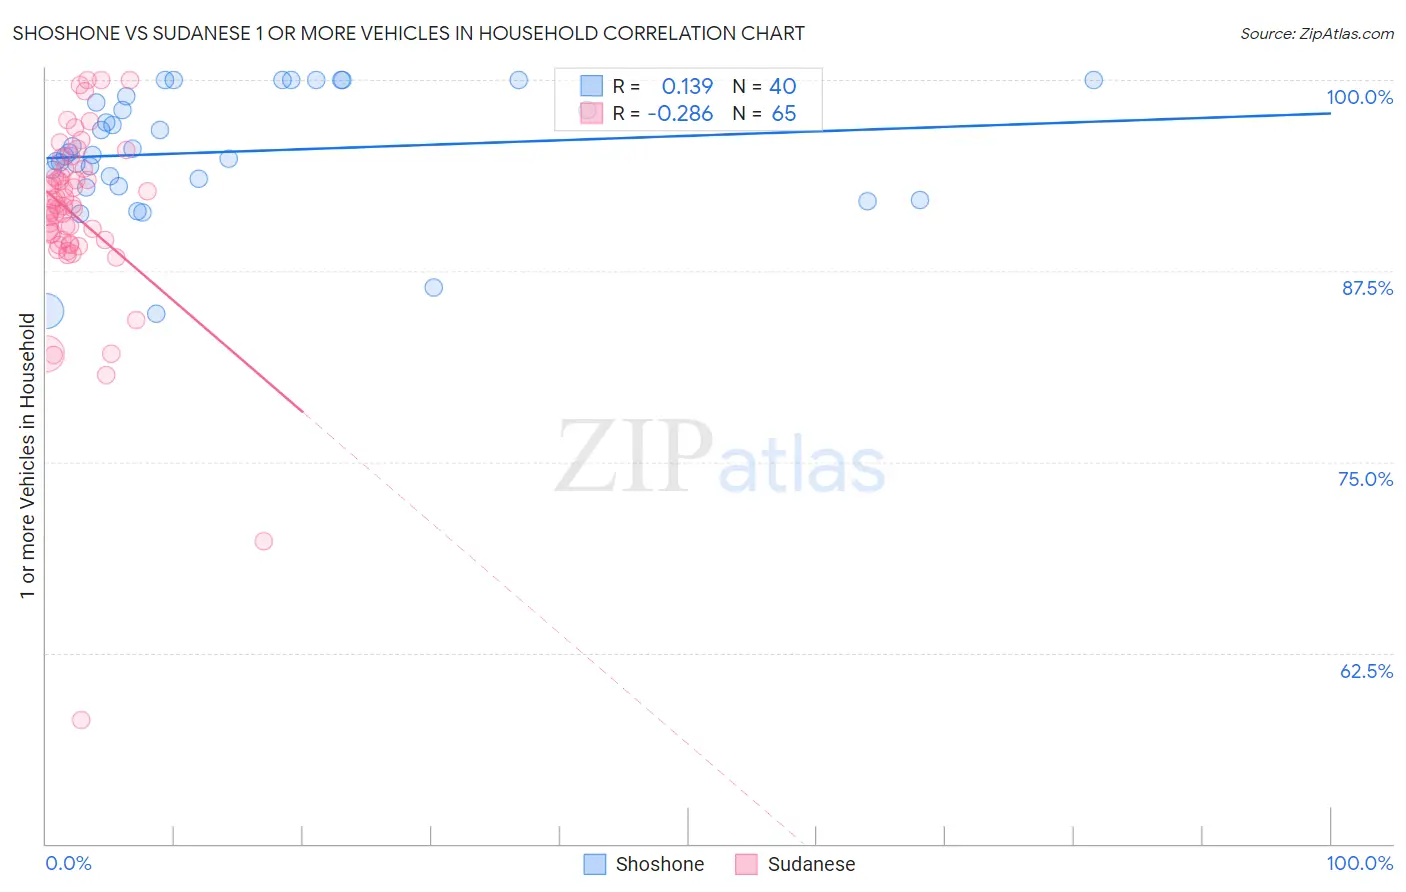
Shoshone vs Sudanese 1 or more Vehicles in Household Correlation Chart
The statistical analysis conducted on geographies consisting of 66,616,007 people shows a poor positive correlation between the proportion of Shoshone and percentage of households with 1 or more vehicles available in the United States with a correlation coefficient (R) of 0.139 and weighted average of 89.5%. Similarly, the statistical analysis conducted on geographies consisting of 110,123,391 people shows a weak negative correlation between the proportion of Sudanese and percentage of households with 1 or more vehicles available in the United States with a correlation coefficient (R) of -0.286 and weighted average of 90.3%, a difference of 0.88%.
1 or more Vehicles in Household Correlation Summary
| Measurement | Shoshone | Sudanese |
| Minimum | 84.7% | 58.1% |
| Maximum | 100.0% | 100.0% |
| Range | 15.3% | 41.9% |
| Mean | 95.3% | 91.1% |
| Median | 95.2% | 91.7% |
| Interquartile 25% (IQ1) | 93.3% | 89.4% |
| Interquartile 75% (IQ3) | 98.7% | 93.9% |
| Interquartile Range (IQR) | 5.4% | 4.5% |
| Standard Deviation (Sample) | 4.0% | 6.5% |
| Standard Deviation (Population) | 4.0% | 6.4% |
Similar Demographics by 1 or more Vehicles in Household
Demographics Similar to Shoshone by 1 or more Vehicles in Household
In terms of 1 or more vehicles in household, the demographic groups most similar to Shoshone are Carpatho Rusyn (89.5%, a difference of 0.0%), Immigrants from Poland (89.5%, a difference of 0.010%), Immigrants from Nepal (89.5%, a difference of 0.020%), Immigrants from North Macedonia (89.5%, a difference of 0.020%), and South American (89.5%, a difference of 0.030%).
| Demographics | Rating | Rank | 1 or more Vehicles in Household |
| Ethiopians | 41.2 /100 | #183 | Average 89.6% |
| Immigrants | Bulgaria | 40.7 /100 | #184 | Average 89.6% |
| Immigrants | Brazil | 40.1 /100 | #185 | Average 89.6% |
| Pueblo | 39.9 /100 | #186 | Fair 89.6% |
| South Americans | 39.6 /100 | #187 | Fair 89.5% |
| Immigrants | Nepal | 38.9 /100 | #188 | Fair 89.5% |
| Carpatho Rusyns | 37.8 /100 | #189 | Fair 89.5% |
| Shoshone | 37.5 /100 | #190 | Fair 89.5% |
| Immigrants | Poland | 37.1 /100 | #191 | Fair 89.5% |
| Immigrants | North Macedonia | 36.5 /100 | #192 | Fair 89.5% |
| Immigrants | Northern Europe | 35.5 /100 | #193 | Fair 89.5% |
| Immigrants | Eritrea | 33.2 /100 | #194 | Fair 89.4% |
| Immigrants | Armenia | 31.8 /100 | #195 | Fair 89.4% |
| Crow | 24.3 /100 | #196 | Fair 89.3% |
| Immigrants | Sweden | 23.6 /100 | #197 | Fair 89.3% |
Demographics Similar to Sudanese by 1 or more Vehicles in Household
In terms of 1 or more vehicles in household, the demographic groups most similar to Sudanese are Estonian (90.3%, a difference of 0.010%), Latvian (90.3%, a difference of 0.030%), Syrian (90.3%, a difference of 0.030%), Hungarian (90.3%, a difference of 0.040%), and Kenyan (90.4%, a difference of 0.060%).
| Demographics | Rating | Rank | 1 or more Vehicles in Household |
| Immigrants | Syria | 87.5 /100 | #133 | Excellent 90.4% |
| Kenyans | 87.0 /100 | #134 | Excellent 90.4% |
| Immigrants | Oceania | 86.9 /100 | #135 | Excellent 90.4% |
| Hungarians | 86.5 /100 | #136 | Excellent 90.3% |
| Latvians | 86.3 /100 | #137 | Excellent 90.3% |
| Syrians | 86.3 /100 | #138 | Excellent 90.3% |
| Estonians | 85.6 /100 | #139 | Excellent 90.3% |
| Sudanese | 85.2 /100 | #140 | Excellent 90.3% |
| Immigrants | Moldova | 83.1 /100 | #141 | Excellent 90.2% |
| Immigrants | Lithuania | 83.0 /100 | #142 | Excellent 90.2% |
| Immigrants | Bahamas | 81.5 /100 | #143 | Excellent 90.2% |
| Immigrants | Zimbabwe | 81.5 /100 | #144 | Excellent 90.2% |
| Sioux | 81.3 /100 | #145 | Excellent 90.2% |
| Bahamians | 80.5 /100 | #146 | Excellent 90.2% |
| Chileans | 79.8 /100 | #147 | Good 90.2% |