Hawaiian vs Immigrants from Scotland 1 or more Vehicles in Household
COMPARE
Hawaiian
Immigrants from Scotland
1 or more Vehicles in Household
1 or more Vehicles in Household Comparison
Hawaiians
Immigrants from Scotland
92.0%
1 OR MORE VEHICLES IN HOUSEHOLD
99.9/ 100
METRIC RATING
53rd/ 347
METRIC RANK
91.8%
1 OR MORE VEHICLES IN HOUSEHOLD
99.7/ 100
METRIC RATING
68th/ 347
METRIC RANK
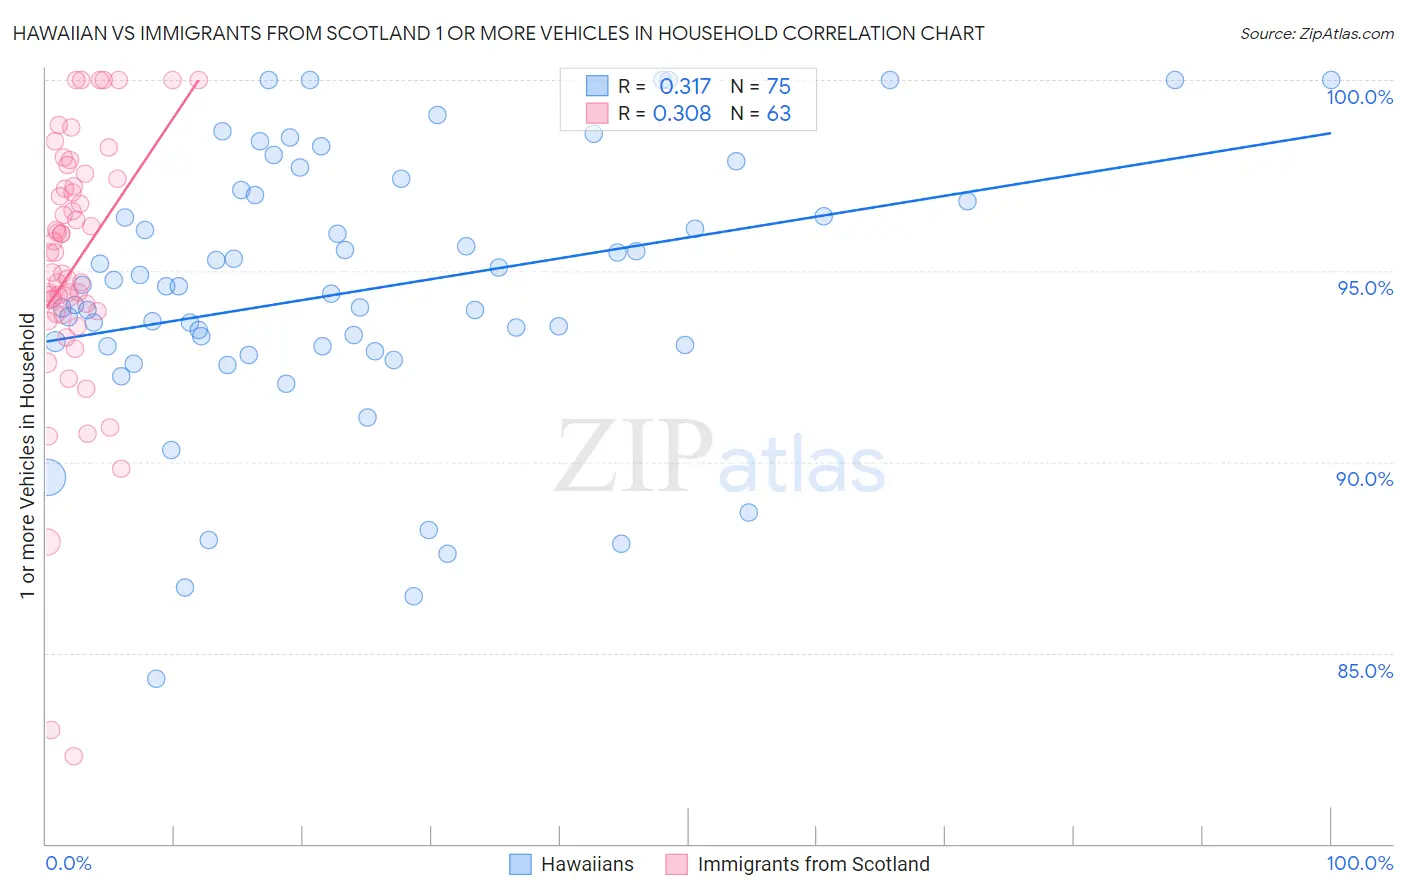
Hawaiian vs Immigrants from Scotland 1 or more Vehicles in Household Correlation Chart
The statistical analysis conducted on geographies consisting of 327,409,815 people shows a mild positive correlation between the proportion of Hawaiians and percentage of households with 1 or more vehicles available in the United States with a correlation coefficient (R) of 0.317 and weighted average of 92.0%. Similarly, the statistical analysis conducted on geographies consisting of 196,228,925 people shows a mild positive correlation between the proportion of Immigrants from Scotland and percentage of households with 1 or more vehicles available in the United States with a correlation coefficient (R) of 0.308 and weighted average of 91.8%, a difference of 0.31%.
1 or more Vehicles in Household Correlation Summary
| Measurement | Hawaiian | Immigrants from Scotland |
| Minimum | 84.3% | 82.3% |
| Maximum | 100.0% | 100.0% |
| Range | 15.7% | 17.7% |
| Mean | 94.5% | 95.1% |
| Median | 94.6% | 95.5% |
| Interquartile 25% (IQ1) | 93.0% | 93.9% |
| Interquartile 75% (IQ3) | 97.0% | 97.4% |
| Interquartile Range (IQR) | 4.0% | 3.5% |
| Standard Deviation (Sample) | 3.5% | 3.5% |
| Standard Deviation (Population) | 3.5% | 3.5% |
Demographics Similar to Hawaiians and Immigrants from Scotland by 1 or more Vehicles in Household
In terms of 1 or more vehicles in household, the demographic groups most similar to Hawaiians are Slovene (92.0%, a difference of 0.010%), Korean (92.1%, a difference of 0.030%), Celtic (92.1%, a difference of 0.060%), Guamanian/Chamorro (92.1%, a difference of 0.070%), and Immigrants from Afghanistan (92.0%, a difference of 0.070%). Similarly, the demographic groups most similar to Immigrants from Scotland are Spaniard (91.8%, a difference of 0.030%), Palestinian (91.7%, a difference of 0.040%), Canadian (91.8%, a difference of 0.060%), Lithuanian (91.7%, a difference of 0.060%), and Immigrants from Laos (91.8%, a difference of 0.080%).
| Demographics | Rating | Rank | 1 or more Vehicles in Household |
| Guamanians/Chamorros | 99.9 /100 | #50 | Exceptional 92.1% |
| Celtics | 99.9 /100 | #51 | Exceptional 92.1% |
| Koreans | 99.9 /100 | #52 | Exceptional 92.1% |
| Hawaiians | 99.9 /100 | #53 | Exceptional 92.0% |
| Slovenes | 99.9 /100 | #54 | Exceptional 92.0% |
| Immigrants | Afghanistan | 99.9 /100 | #55 | Exceptional 92.0% |
| Immigrants | Venezuela | 99.9 /100 | #56 | Exceptional 92.0% |
| Iraqis | 99.8 /100 | #57 | Exceptional 91.9% |
| Immigrants | Mexico | 99.8 /100 | #58 | Exceptional 91.9% |
| Venezuelans | 99.8 /100 | #59 | Exceptional 91.9% |
| Slovaks | 99.8 /100 | #60 | Exceptional 91.9% |
| Immigrants | India | 99.8 /100 | #61 | Exceptional 91.9% |
| Thais | 99.8 /100 | #62 | Exceptional 91.9% |
| Chinese | 99.8 /100 | #63 | Exceptional 91.9% |
| Croatians | 99.8 /100 | #64 | Exceptional 91.9% |
| Immigrants | Laos | 99.8 /100 | #65 | Exceptional 91.8% |
| Canadians | 99.8 /100 | #66 | Exceptional 91.8% |
| Spaniards | 99.8 /100 | #67 | Exceptional 91.8% |
| Immigrants | Scotland | 99.7 /100 | #68 | Exceptional 91.8% |
| Palestinians | 99.7 /100 | #69 | Exceptional 91.7% |
| Lithuanians | 99.7 /100 | #70 | Exceptional 91.7% |