Shoshone vs Immigrants from Ghana 1 or more Vehicles in Household
COMPARE
Shoshone
Immigrants from Ghana
1 or more Vehicles in Household
1 or more Vehicles in Household Comparison
Shoshone
Immigrants from Ghana
89.5%
1 OR MORE VEHICLES IN HOUSEHOLD
37.5/ 100
METRIC RATING
190th/ 347
METRIC RANK
83.4%
1 OR MORE VEHICLES IN HOUSEHOLD
0.0/ 100
METRIC RATING
318th/ 347
METRIC RANK
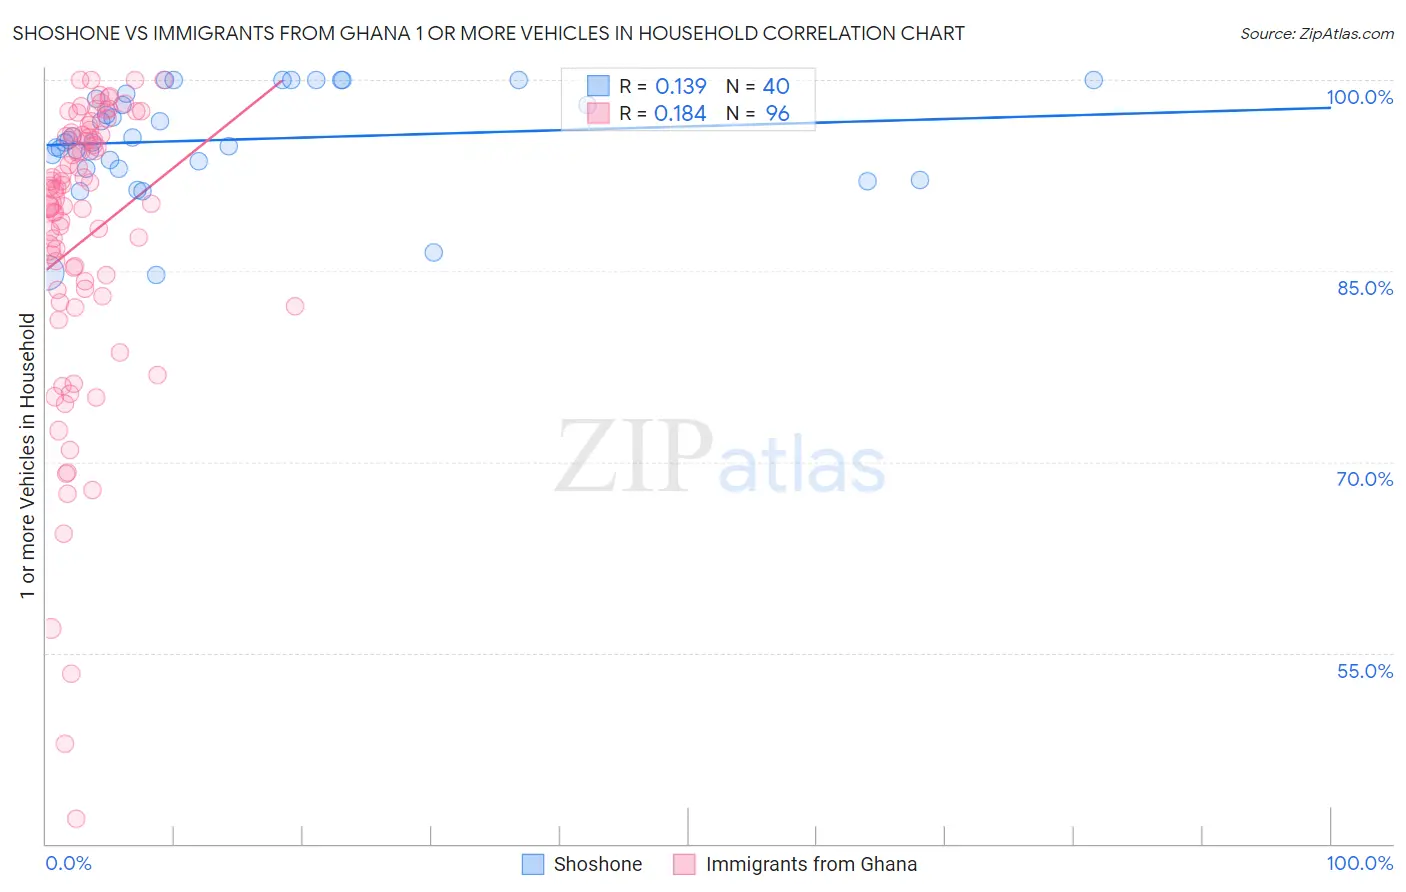
Shoshone vs Immigrants from Ghana 1 or more Vehicles in Household Correlation Chart
The statistical analysis conducted on geographies consisting of 66,616,007 people shows a poor positive correlation between the proportion of Shoshone and percentage of households with 1 or more vehicles available in the United States with a correlation coefficient (R) of 0.139 and weighted average of 89.5%. Similarly, the statistical analysis conducted on geographies consisting of 199,558,175 people shows a poor positive correlation between the proportion of Immigrants from Ghana and percentage of households with 1 or more vehicles available in the United States with a correlation coefficient (R) of 0.184 and weighted average of 83.4%, a difference of 7.3%.
1 or more Vehicles in Household Correlation Summary
| Measurement | Shoshone | Immigrants from Ghana |
| Minimum | 84.7% | 42.0% |
| Maximum | 100.0% | 100.0% |
| Range | 15.3% | 58.0% |
| Mean | 95.3% | 87.4% |
| Median | 95.2% | 90.5% |
| Interquartile 25% (IQ1) | 93.3% | 83.3% |
| Interquartile 75% (IQ3) | 98.7% | 95.6% |
| Interquartile Range (IQR) | 5.4% | 12.3% |
| Standard Deviation (Sample) | 4.0% | 11.7% |
| Standard Deviation (Population) | 4.0% | 11.7% |
Similar Demographics by 1 or more Vehicles in Household
Demographics Similar to Shoshone by 1 or more Vehicles in Household
In terms of 1 or more vehicles in household, the demographic groups most similar to Shoshone are Carpatho Rusyn (89.5%, a difference of 0.0%), Immigrants from Poland (89.5%, a difference of 0.010%), Immigrants from Nepal (89.5%, a difference of 0.020%), Immigrants from North Macedonia (89.5%, a difference of 0.020%), and South American (89.5%, a difference of 0.030%).
| Demographics | Rating | Rank | 1 or more Vehicles in Household |
| Ethiopians | 41.2 /100 | #183 | Average 89.6% |
| Immigrants | Bulgaria | 40.7 /100 | #184 | Average 89.6% |
| Immigrants | Brazil | 40.1 /100 | #185 | Average 89.6% |
| Pueblo | 39.9 /100 | #186 | Fair 89.6% |
| South Americans | 39.6 /100 | #187 | Fair 89.5% |
| Immigrants | Nepal | 38.9 /100 | #188 | Fair 89.5% |
| Carpatho Rusyns | 37.8 /100 | #189 | Fair 89.5% |
| Shoshone | 37.5 /100 | #190 | Fair 89.5% |
| Immigrants | Poland | 37.1 /100 | #191 | Fair 89.5% |
| Immigrants | North Macedonia | 36.5 /100 | #192 | Fair 89.5% |
| Immigrants | Northern Europe | 35.5 /100 | #193 | Fair 89.5% |
| Immigrants | Eritrea | 33.2 /100 | #194 | Fair 89.4% |
| Immigrants | Armenia | 31.8 /100 | #195 | Fair 89.4% |
| Crow | 24.3 /100 | #196 | Fair 89.3% |
| Immigrants | Sweden | 23.6 /100 | #197 | Fair 89.3% |
Demographics Similar to Immigrants from Ghana by 1 or more Vehicles in Household
In terms of 1 or more vehicles in household, the demographic groups most similar to Immigrants from Ghana are Immigrants from Belarus (83.3%, a difference of 0.13%), Ghanaian (83.6%, a difference of 0.20%), Alaska Native (83.8%, a difference of 0.42%), Soviet Union (82.7%, a difference of 0.94%), and Cypriot (84.4%, a difference of 1.1%).
| Demographics | Rating | Rank | 1 or more Vehicles in Household |
| Puerto Ricans | 0.0 /100 | #311 | Tragic 84.6% |
| Cape Verdeans | 0.0 /100 | #312 | Tragic 84.5% |
| Immigrants | Israel | 0.0 /100 | #313 | Tragic 84.5% |
| Albanians | 0.0 /100 | #314 | Tragic 84.4% |
| Cypriots | 0.0 /100 | #315 | Tragic 84.4% |
| Alaska Natives | 0.0 /100 | #316 | Tragic 83.8% |
| Ghanaians | 0.0 /100 | #317 | Tragic 83.6% |
| Immigrants | Ghana | 0.0 /100 | #318 | Tragic 83.4% |
| Immigrants | Belarus | 0.0 /100 | #319 | Tragic 83.3% |
| Soviet Union | 0.0 /100 | #320 | Tragic 82.7% |
| Jamaicans | 0.0 /100 | #321 | Tragic 82.1% |
| Immigrants | Cabo Verde | 0.0 /100 | #322 | Tragic 81.6% |
| Immigrants | Yemen | 0.0 /100 | #323 | Tragic 80.5% |
| Immigrants | Caribbean | 0.0 /100 | #324 | Tragic 80.4% |
| Senegalese | 0.0 /100 | #325 | Tragic 80.4% |