Immigrants from Cameroon vs Immigrants from Ghana 1 or more Vehicles in Household
COMPARE
Immigrants from Cameroon
Immigrants from Ghana
1 or more Vehicles in Household
1 or more Vehicles in Household Comparison
Immigrants from Cameroon
Immigrants from Ghana
90.4%
1 OR MORE VEHICLES IN HOUSEHOLD
89.4/ 100
METRIC RATING
126th/ 347
METRIC RANK
83.4%
1 OR MORE VEHICLES IN HOUSEHOLD
0.0/ 100
METRIC RATING
318th/ 347
METRIC RANK
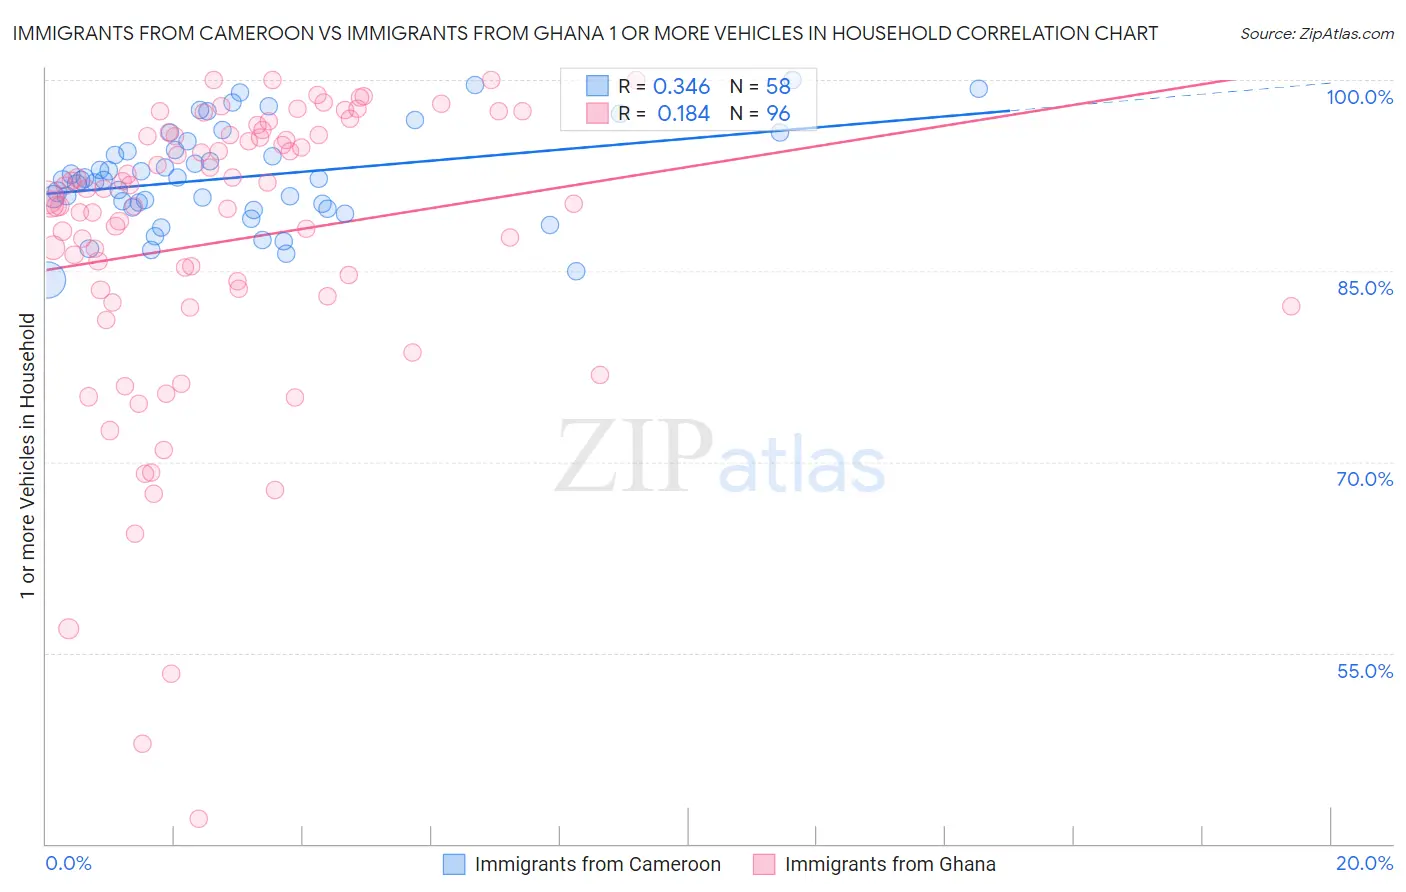
Immigrants from Cameroon vs Immigrants from Ghana 1 or more Vehicles in Household Correlation Chart
The statistical analysis conducted on geographies consisting of 130,744,557 people shows a mild positive correlation between the proportion of Immigrants from Cameroon and percentage of households with 1 or more vehicles available in the United States with a correlation coefficient (R) of 0.346 and weighted average of 90.4%. Similarly, the statistical analysis conducted on geographies consisting of 199,558,175 people shows a poor positive correlation between the proportion of Immigrants from Ghana and percentage of households with 1 or more vehicles available in the United States with a correlation coefficient (R) of 0.184 and weighted average of 83.4%, a difference of 8.4%.
1 or more Vehicles in Household Correlation Summary
| Measurement | Immigrants from Cameroon | Immigrants from Ghana |
| Minimum | 84.2% | 42.0% |
| Maximum | 100.0% | 100.0% |
| Range | 15.8% | 58.0% |
| Mean | 92.4% | 87.4% |
| Median | 92.2% | 90.5% |
| Interquartile 25% (IQ1) | 90.0% | 83.3% |
| Interquartile 75% (IQ3) | 94.5% | 95.6% |
| Interquartile Range (IQR) | 4.5% | 12.3% |
| Standard Deviation (Sample) | 3.8% | 11.7% |
| Standard Deviation (Population) | 3.8% | 11.7% |
Similar Demographics by 1 or more Vehicles in Household
Demographics Similar to Immigrants from Cameroon by 1 or more Vehicles in Household
In terms of 1 or more vehicles in household, the demographic groups most similar to Immigrants from Cameroon are Immigrants from the Azores (90.4%, a difference of 0.010%), Burmese (90.4%, a difference of 0.010%), Marshallese (90.4%, a difference of 0.020%), Nicaraguan (90.4%, a difference of 0.020%), and Immigrants from Kenya (90.4%, a difference of 0.040%).
| Demographics | Rating | Rank | 1 or more Vehicles in Household |
| Blackfeet | 92.6 /100 | #119 | Exceptional 90.6% |
| Immigrants | Thailand | 92.3 /100 | #120 | Exceptional 90.6% |
| Icelanders | 92.1 /100 | #121 | Exceptional 90.5% |
| Costa Ricans | 92.0 /100 | #122 | Exceptional 90.5% |
| Fijians | 91.8 /100 | #123 | Exceptional 90.5% |
| Puget Sound Salish | 91.5 /100 | #124 | Exceptional 90.5% |
| Immigrants | Korea | 90.5 /100 | #125 | Exceptional 90.5% |
| Immigrants | Cameroon | 89.4 /100 | #126 | Excellent 90.4% |
| Immigrants | Azores | 89.1 /100 | #127 | Excellent 90.4% |
| Burmese | 89.0 /100 | #128 | Excellent 90.4% |
| Marshallese | 88.9 /100 | #129 | Excellent 90.4% |
| Nicaraguans | 88.8 /100 | #130 | Excellent 90.4% |
| Immigrants | Kenya | 88.5 /100 | #131 | Excellent 90.4% |
| Immigrants | South Africa | 88.1 /100 | #132 | Excellent 90.4% |
| Immigrants | Syria | 87.5 /100 | #133 | Excellent 90.4% |
Demographics Similar to Immigrants from Ghana by 1 or more Vehicles in Household
In terms of 1 or more vehicles in household, the demographic groups most similar to Immigrants from Ghana are Immigrants from Belarus (83.3%, a difference of 0.13%), Ghanaian (83.6%, a difference of 0.20%), Alaska Native (83.8%, a difference of 0.42%), Soviet Union (82.7%, a difference of 0.94%), and Cypriot (84.4%, a difference of 1.1%).
| Demographics | Rating | Rank | 1 or more Vehicles in Household |
| Puerto Ricans | 0.0 /100 | #311 | Tragic 84.6% |
| Cape Verdeans | 0.0 /100 | #312 | Tragic 84.5% |
| Immigrants | Israel | 0.0 /100 | #313 | Tragic 84.5% |
| Albanians | 0.0 /100 | #314 | Tragic 84.4% |
| Cypriots | 0.0 /100 | #315 | Tragic 84.4% |
| Alaska Natives | 0.0 /100 | #316 | Tragic 83.8% |
| Ghanaians | 0.0 /100 | #317 | Tragic 83.6% |
| Immigrants | Ghana | 0.0 /100 | #318 | Tragic 83.4% |
| Immigrants | Belarus | 0.0 /100 | #319 | Tragic 83.3% |
| Soviet Union | 0.0 /100 | #320 | Tragic 82.7% |
| Jamaicans | 0.0 /100 | #321 | Tragic 82.1% |
| Immigrants | Cabo Verde | 0.0 /100 | #322 | Tragic 81.6% |
| Immigrants | Yemen | 0.0 /100 | #323 | Tragic 80.5% |
| Immigrants | Caribbean | 0.0 /100 | #324 | Tragic 80.4% |
| Senegalese | 0.0 /100 | #325 | Tragic 80.4% |