Bulgarian vs Immigrants from Ghana 1 or more Vehicles in Household
COMPARE
Bulgarian
Immigrants from Ghana
1 or more Vehicles in Household
1 or more Vehicles in Household Comparison
Bulgarians
Immigrants from Ghana
91.1%
1 OR MORE VEHICLES IN HOUSEHOLD
98.4/ 100
METRIC RATING
101st/ 347
METRIC RANK
83.4%
1 OR MORE VEHICLES IN HOUSEHOLD
0.0/ 100
METRIC RATING
318th/ 347
METRIC RANK
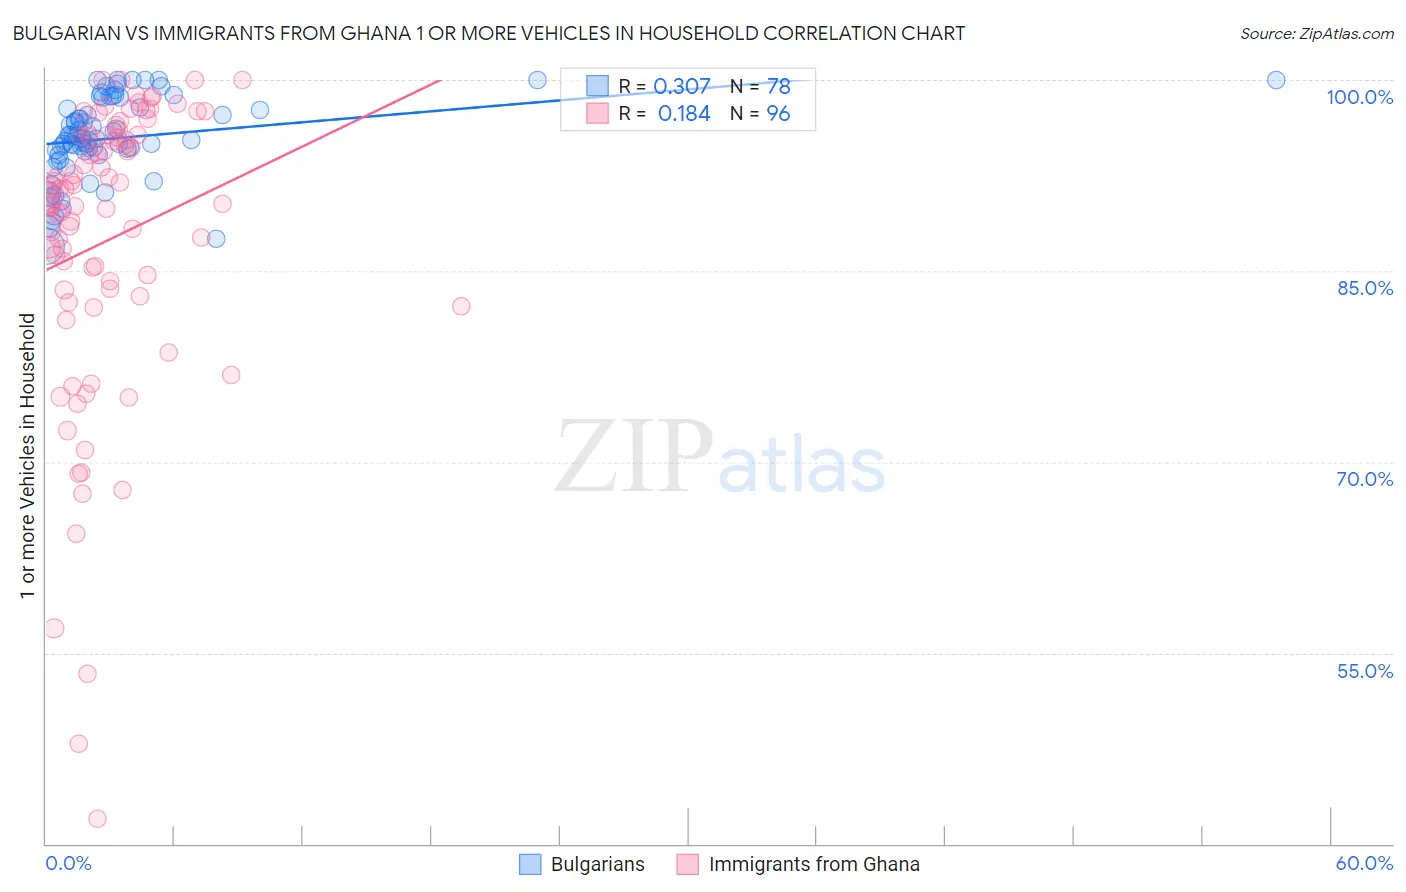
Bulgarian vs Immigrants from Ghana 1 or more Vehicles in Household Correlation Chart
The statistical analysis conducted on geographies consisting of 205,574,204 people shows a mild positive correlation between the proportion of Bulgarians and percentage of households with 1 or more vehicles available in the United States with a correlation coefficient (R) of 0.307 and weighted average of 91.1%. Similarly, the statistical analysis conducted on geographies consisting of 199,558,175 people shows a poor positive correlation between the proportion of Immigrants from Ghana and percentage of households with 1 or more vehicles available in the United States with a correlation coefficient (R) of 0.184 and weighted average of 83.4%, a difference of 9.2%.
1 or more Vehicles in Household Correlation Summary
| Measurement | Bulgarian | Immigrants from Ghana |
| Minimum | 86.9% | 42.0% |
| Maximum | 100.0% | 100.0% |
| Range | 13.1% | 58.0% |
| Mean | 95.5% | 87.4% |
| Median | 95.4% | 90.5% |
| Interquartile 25% (IQ1) | 94.1% | 83.3% |
| Interquartile 75% (IQ3) | 97.8% | 95.6% |
| Interquartile Range (IQR) | 3.7% | 12.3% |
| Standard Deviation (Sample) | 3.2% | 11.7% |
| Standard Deviation (Population) | 3.2% | 11.7% |
Similar Demographics by 1 or more Vehicles in Household
Demographics Similar to Bulgarians by 1 or more Vehicles in Household
In terms of 1 or more vehicles in household, the demographic groups most similar to Bulgarians are Immigrants from Central America (91.1%, a difference of 0.010%), Seminole (91.1%, a difference of 0.020%), Yugoslavian (91.1%, a difference of 0.030%), Asian (91.1%, a difference of 0.040%), and Immigrants from Bolivia (91.2%, a difference of 0.050%).
| Demographics | Rating | Rank | 1 or more Vehicles in Household |
| Immigrants | Cuba | 99.1 /100 | #94 | Exceptional 91.3% |
| Austrians | 99.0 /100 | #95 | Exceptional 91.3% |
| Potawatomi | 99.0 /100 | #96 | Exceptional 91.3% |
| Pakistanis | 99.0 /100 | #97 | Exceptional 91.3% |
| Slavs | 98.7 /100 | #98 | Exceptional 91.2% |
| Immigrants | Bolivia | 98.6 /100 | #99 | Exceptional 91.2% |
| Immigrants | Central America | 98.4 /100 | #100 | Exceptional 91.1% |
| Bulgarians | 98.4 /100 | #101 | Exceptional 91.1% |
| Seminole | 98.3 /100 | #102 | Exceptional 91.1% |
| Yugoslavians | 98.3 /100 | #103 | Exceptional 91.1% |
| Asians | 98.2 /100 | #104 | Exceptional 91.1% |
| Laotians | 98.0 /100 | #105 | Exceptional 91.0% |
| Zimbabweans | 97.7 /100 | #106 | Exceptional 91.0% |
| Maltese | 97.7 /100 | #107 | Exceptional 91.0% |
| Hispanics or Latinos | 97.6 /100 | #108 | Exceptional 91.0% |
Demographics Similar to Immigrants from Ghana by 1 or more Vehicles in Household
In terms of 1 or more vehicles in household, the demographic groups most similar to Immigrants from Ghana are Immigrants from Belarus (83.3%, a difference of 0.13%), Ghanaian (83.6%, a difference of 0.20%), Alaska Native (83.8%, a difference of 0.42%), Soviet Union (82.7%, a difference of 0.94%), and Cypriot (84.4%, a difference of 1.1%).
| Demographics | Rating | Rank | 1 or more Vehicles in Household |
| Puerto Ricans | 0.0 /100 | #311 | Tragic 84.6% |
| Cape Verdeans | 0.0 /100 | #312 | Tragic 84.5% |
| Immigrants | Israel | 0.0 /100 | #313 | Tragic 84.5% |
| Albanians | 0.0 /100 | #314 | Tragic 84.4% |
| Cypriots | 0.0 /100 | #315 | Tragic 84.4% |
| Alaska Natives | 0.0 /100 | #316 | Tragic 83.8% |
| Ghanaians | 0.0 /100 | #317 | Tragic 83.6% |
| Immigrants | Ghana | 0.0 /100 | #318 | Tragic 83.4% |
| Immigrants | Belarus | 0.0 /100 | #319 | Tragic 83.3% |
| Soviet Union | 0.0 /100 | #320 | Tragic 82.7% |
| Jamaicans | 0.0 /100 | #321 | Tragic 82.1% |
| Immigrants | Cabo Verde | 0.0 /100 | #322 | Tragic 81.6% |
| Immigrants | Yemen | 0.0 /100 | #323 | Tragic 80.5% |
| Immigrants | Caribbean | 0.0 /100 | #324 | Tragic 80.4% |
| Senegalese | 0.0 /100 | #325 | Tragic 80.4% |