Immigrants from Costa Rica vs Immigrants from Ghana 1 or more Vehicles in Household
COMPARE
Immigrants from Costa Rica
Immigrants from Ghana
1 or more Vehicles in Household
1 or more Vehicles in Household Comparison
Immigrants from Costa Rica
Immigrants from Ghana
89.8%
1 OR MORE VEHICLES IN HOUSEHOLD
57.6/ 100
METRIC RATING
170th/ 347
METRIC RANK
83.4%
1 OR MORE VEHICLES IN HOUSEHOLD
0.0/ 100
METRIC RATING
318th/ 347
METRIC RANK
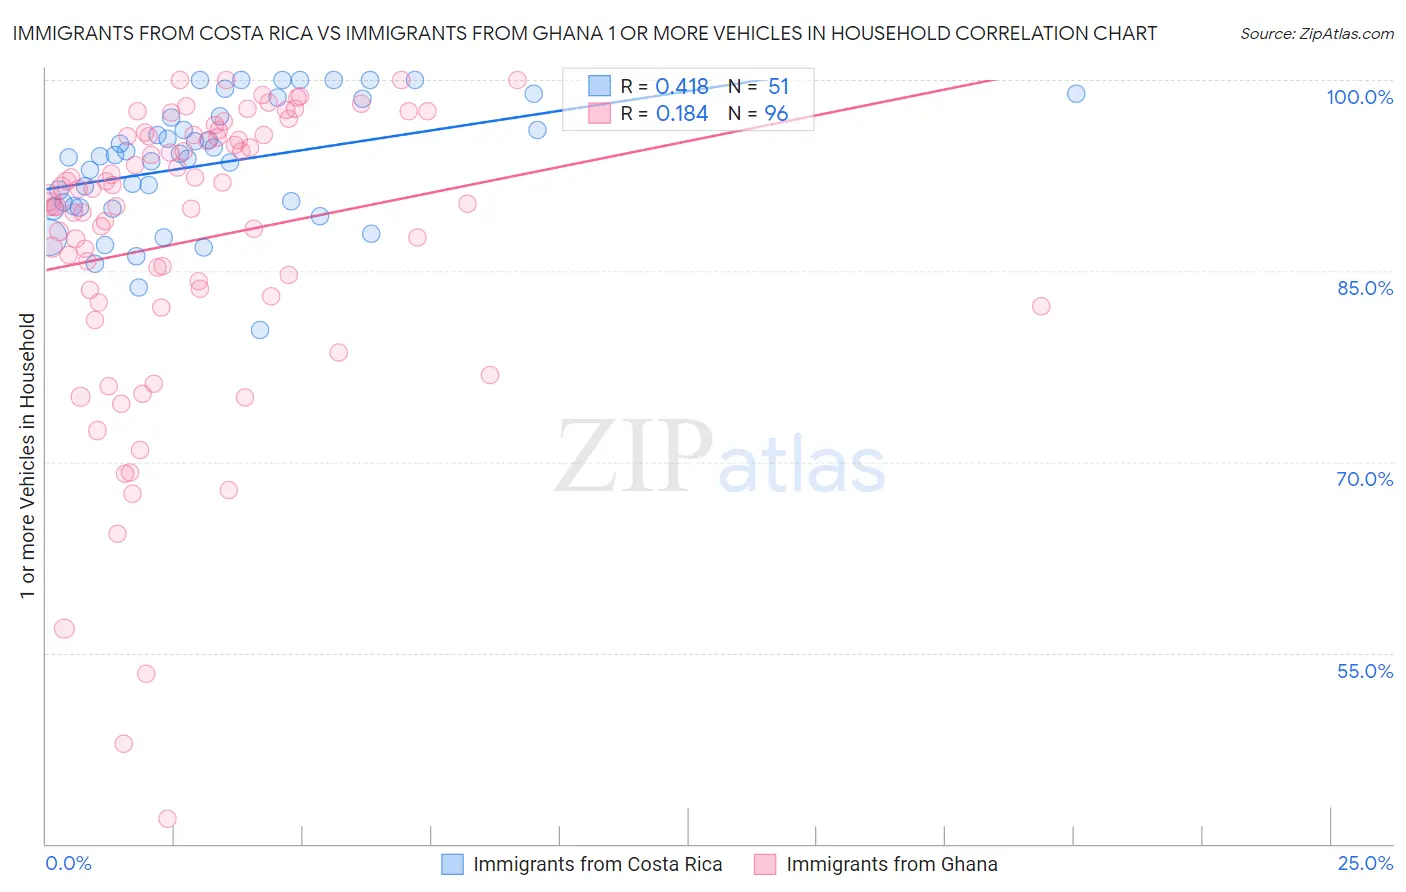
Immigrants from Costa Rica vs Immigrants from Ghana 1 or more Vehicles in Household Correlation Chart
The statistical analysis conducted on geographies consisting of 204,257,602 people shows a moderate positive correlation between the proportion of Immigrants from Costa Rica and percentage of households with 1 or more vehicles available in the United States with a correlation coefficient (R) of 0.418 and weighted average of 89.8%. Similarly, the statistical analysis conducted on geographies consisting of 199,558,175 people shows a poor positive correlation between the proportion of Immigrants from Ghana and percentage of households with 1 or more vehicles available in the United States with a correlation coefficient (R) of 0.184 and weighted average of 83.4%, a difference of 7.6%.
1 or more Vehicles in Household Correlation Summary
| Measurement | Immigrants from Costa Rica | Immigrants from Ghana |
| Minimum | 80.3% | 42.0% |
| Maximum | 100.0% | 100.0% |
| Range | 19.7% | 58.0% |
| Mean | 93.4% | 87.4% |
| Median | 94.0% | 90.5% |
| Interquartile 25% (IQ1) | 90.0% | 83.3% |
| Interquartile 75% (IQ3) | 97.2% | 95.6% |
| Interquartile Range (IQR) | 7.2% | 12.3% |
| Standard Deviation (Sample) | 4.8% | 11.7% |
| Standard Deviation (Population) | 4.8% | 11.7% |
Similar Demographics by 1 or more Vehicles in Household
Demographics Similar to Immigrants from Costa Rica by 1 or more Vehicles in Household
In terms of 1 or more vehicles in household, the demographic groups most similar to Immigrants from Costa Rica are Native/Alaskan (89.8%, a difference of 0.030%), Immigrants from Latin America (89.8%, a difference of 0.040%), Immigrants from Cambodia (89.8%, a difference of 0.040%), French American Indian (89.8%, a difference of 0.050%), and Indonesian (89.7%, a difference of 0.070%).
| Demographics | Rating | Rank | 1 or more Vehicles in Household |
| Immigrants | Austria | 65.5 /100 | #163 | Good 89.9% |
| Comanche | 63.4 /100 | #164 | Good 89.9% |
| Immigrants | Saudi Arabia | 62.6 /100 | #165 | Good 89.9% |
| Immigrants | Middle Africa | 62.2 /100 | #166 | Good 89.9% |
| Immigrants | Latin America | 60.3 /100 | #167 | Good 89.8% |
| Immigrants | Cambodia | 60.1 /100 | #168 | Good 89.8% |
| Natives/Alaskans | 59.5 /100 | #169 | Average 89.8% |
| Immigrants | Costa Rica | 57.6 /100 | #170 | Average 89.8% |
| French American Indians | 54.4 /100 | #171 | Average 89.8% |
| Indonesians | 53.0 /100 | #172 | Average 89.7% |
| Lumbee | 52.8 /100 | #173 | Average 89.7% |
| Filipinos | 50.0 /100 | #174 | Average 89.7% |
| Immigrants | Burma/Myanmar | 47.6 /100 | #175 | Average 89.7% |
| Immigrants | Sudan | 47.1 /100 | #176 | Average 89.7% |
| Hmong | 45.8 /100 | #177 | Average 89.6% |
Demographics Similar to Immigrants from Ghana by 1 or more Vehicles in Household
In terms of 1 or more vehicles in household, the demographic groups most similar to Immigrants from Ghana are Immigrants from Belarus (83.3%, a difference of 0.13%), Ghanaian (83.6%, a difference of 0.20%), Alaska Native (83.8%, a difference of 0.42%), Soviet Union (82.7%, a difference of 0.94%), and Cypriot (84.4%, a difference of 1.1%).
| Demographics | Rating | Rank | 1 or more Vehicles in Household |
| Puerto Ricans | 0.0 /100 | #311 | Tragic 84.6% |
| Cape Verdeans | 0.0 /100 | #312 | Tragic 84.5% |
| Immigrants | Israel | 0.0 /100 | #313 | Tragic 84.5% |
| Albanians | 0.0 /100 | #314 | Tragic 84.4% |
| Cypriots | 0.0 /100 | #315 | Tragic 84.4% |
| Alaska Natives | 0.0 /100 | #316 | Tragic 83.8% |
| Ghanaians | 0.0 /100 | #317 | Tragic 83.6% |
| Immigrants | Ghana | 0.0 /100 | #318 | Tragic 83.4% |
| Immigrants | Belarus | 0.0 /100 | #319 | Tragic 83.3% |
| Soviet Union | 0.0 /100 | #320 | Tragic 82.7% |
| Jamaicans | 0.0 /100 | #321 | Tragic 82.1% |
| Immigrants | Cabo Verde | 0.0 /100 | #322 | Tragic 81.6% |
| Immigrants | Yemen | 0.0 /100 | #323 | Tragic 80.5% |
| Immigrants | Caribbean | 0.0 /100 | #324 | Tragic 80.4% |
| Senegalese | 0.0 /100 | #325 | Tragic 80.4% |