Okinawan vs Immigrants from Ghana 1 or more Vehicles in Household
COMPARE
Okinawan
Immigrants from Ghana
1 or more Vehicles in Household
1 or more Vehicles in Household Comparison
Okinawans
Immigrants from Ghana
86.1%
1 OR MORE VEHICLES IN HOUSEHOLD
0.0/ 100
METRIC RATING
292nd/ 347
METRIC RANK
83.4%
1 OR MORE VEHICLES IN HOUSEHOLD
0.0/ 100
METRIC RATING
318th/ 347
METRIC RANK
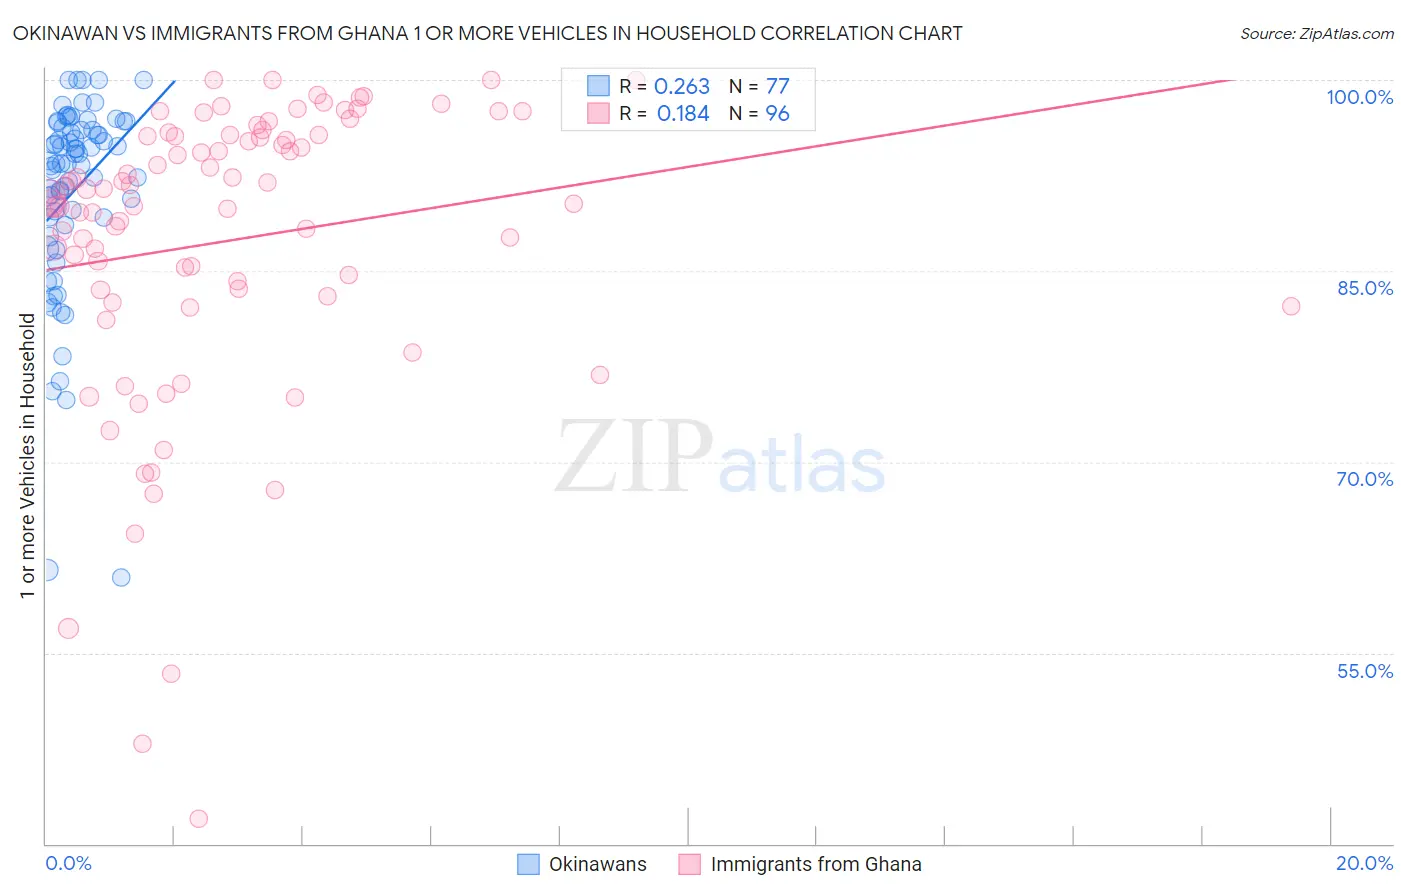
Okinawan vs Immigrants from Ghana 1 or more Vehicles in Household Correlation Chart
The statistical analysis conducted on geographies consisting of 73,660,740 people shows a weak positive correlation between the proportion of Okinawans and percentage of households with 1 or more vehicles available in the United States with a correlation coefficient (R) of 0.263 and weighted average of 86.1%. Similarly, the statistical analysis conducted on geographies consisting of 199,558,175 people shows a poor positive correlation between the proportion of Immigrants from Ghana and percentage of households with 1 or more vehicles available in the United States with a correlation coefficient (R) of 0.184 and weighted average of 83.4%, a difference of 3.2%.
1 or more Vehicles in Household Correlation Summary
| Measurement | Okinawan | Immigrants from Ghana |
| Minimum | 60.9% | 42.0% |
| Maximum | 100.0% | 100.0% |
| Range | 39.1% | 58.0% |
| Mean | 91.2% | 87.4% |
| Median | 93.4% | 90.5% |
| Interquartile 25% (IQ1) | 88.9% | 83.3% |
| Interquartile 75% (IQ3) | 96.2% | 95.6% |
| Interquartile Range (IQR) | 7.3% | 12.3% |
| Standard Deviation (Sample) | 7.8% | 11.7% |
| Standard Deviation (Population) | 7.7% | 11.7% |
Similar Demographics by 1 or more Vehicles in Household
Demographics Similar to Okinawans by 1 or more Vehicles in Household
In terms of 1 or more vehicles in household, the demographic groups most similar to Okinawans are Indian (Asian) (86.0%, a difference of 0.060%), Alaskan Athabascan (86.0%, a difference of 0.13%), Pima (86.3%, a difference of 0.23%), Immigrants from Jamaica (85.8%, a difference of 0.30%), and Immigrants from Australia (86.4%, a difference of 0.31%).
| Demographics | Rating | Rank | 1 or more Vehicles in Household |
| Immigrants | Kazakhstan | 0.0 /100 | #285 | Tragic 86.6% |
| Immigrants | Eastern Asia | 0.0 /100 | #286 | Tragic 86.5% |
| Immigrants | Malaysia | 0.0 /100 | #287 | Tragic 86.5% |
| Hopi | 0.0 /100 | #288 | Tragic 86.4% |
| Immigrants | Ireland | 0.0 /100 | #289 | Tragic 86.4% |
| Immigrants | Australia | 0.0 /100 | #290 | Tragic 86.4% |
| Pima | 0.0 /100 | #291 | Tragic 86.3% |
| Okinawans | 0.0 /100 | #292 | Tragic 86.1% |
| Indians (Asian) | 0.0 /100 | #293 | Tragic 86.0% |
| Alaskan Athabascans | 0.0 /100 | #294 | Tragic 86.0% |
| Immigrants | Jamaica | 0.0 /100 | #295 | Tragic 85.8% |
| Immigrants | Spain | 0.0 /100 | #296 | Tragic 85.8% |
| Paraguayans | 0.0 /100 | #297 | Tragic 85.7% |
| Belizeans | 0.0 /100 | #298 | Tragic 85.7% |
| Yuman | 0.0 /100 | #299 | Tragic 85.5% |
Demographics Similar to Immigrants from Ghana by 1 or more Vehicles in Household
In terms of 1 or more vehicles in household, the demographic groups most similar to Immigrants from Ghana are Immigrants from Belarus (83.3%, a difference of 0.13%), Ghanaian (83.6%, a difference of 0.20%), Alaska Native (83.8%, a difference of 0.42%), Soviet Union (82.7%, a difference of 0.94%), and Cypriot (84.4%, a difference of 1.1%).
| Demographics | Rating | Rank | 1 or more Vehicles in Household |
| Puerto Ricans | 0.0 /100 | #311 | Tragic 84.6% |
| Cape Verdeans | 0.0 /100 | #312 | Tragic 84.5% |
| Immigrants | Israel | 0.0 /100 | #313 | Tragic 84.5% |
| Albanians | 0.0 /100 | #314 | Tragic 84.4% |
| Cypriots | 0.0 /100 | #315 | Tragic 84.4% |
| Alaska Natives | 0.0 /100 | #316 | Tragic 83.8% |
| Ghanaians | 0.0 /100 | #317 | Tragic 83.6% |
| Immigrants | Ghana | 0.0 /100 | #318 | Tragic 83.4% |
| Immigrants | Belarus | 0.0 /100 | #319 | Tragic 83.3% |
| Soviet Union | 0.0 /100 | #320 | Tragic 82.7% |
| Jamaicans | 0.0 /100 | #321 | Tragic 82.1% |
| Immigrants | Cabo Verde | 0.0 /100 | #322 | Tragic 81.6% |
| Immigrants | Yemen | 0.0 /100 | #323 | Tragic 80.5% |
| Immigrants | Caribbean | 0.0 /100 | #324 | Tragic 80.4% |
| Senegalese | 0.0 /100 | #325 | Tragic 80.4% |