Serbian vs Slavic 3 or more Vehicles in Household
COMPARE
Serbian
Slavic
3 or more Vehicles in Household
3 or more Vehicles in Household Comparison
Serbians
Slavs
19.1%
3 OR MORE VEHICLES IN HOUSEHOLD
24.0/ 100
METRIC RATING
194th/ 347
METRIC RANK
20.4%
3 OR MORE VEHICLES IN HOUSEHOLD
92.1/ 100
METRIC RATING
126th/ 347
METRIC RANK
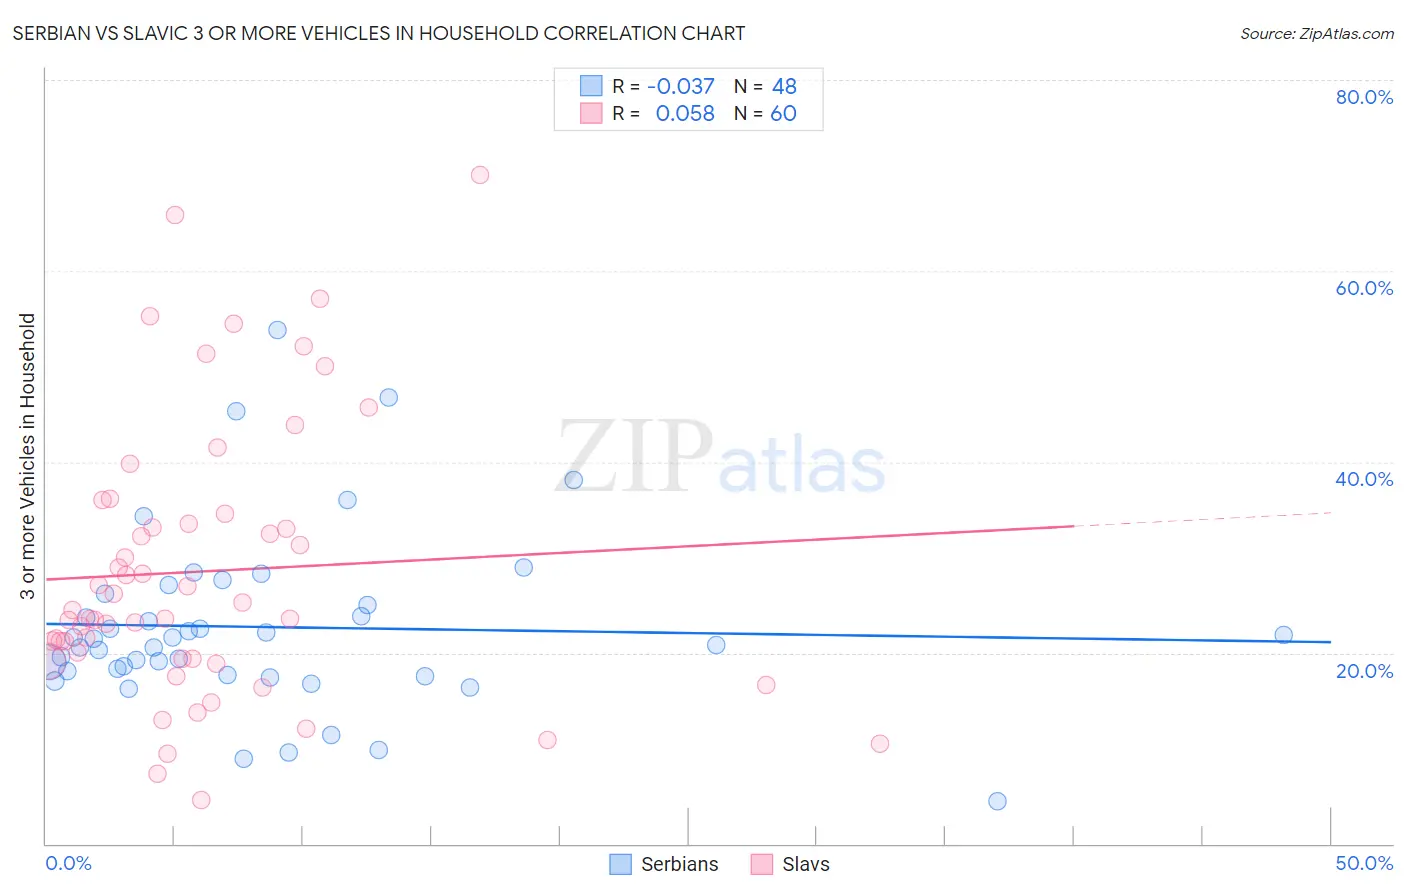
Serbian vs Slavic 3 or more Vehicles in Household Correlation Chart
The statistical analysis conducted on geographies consisting of 267,464,663 people shows no correlation between the proportion of Serbians and percentage of households with 3 or more vehicles available in the United States with a correlation coefficient (R) of -0.037 and weighted average of 19.1%. Similarly, the statistical analysis conducted on geographies consisting of 270,770,751 people shows a slight positive correlation between the proportion of Slavs and percentage of households with 3 or more vehicles available in the United States with a correlation coefficient (R) of 0.058 and weighted average of 20.4%, a difference of 7.0%.
3 or more Vehicles in Household Correlation Summary
| Measurement | Serbian | Slavic |
| Minimum | 4.5% | 4.6% |
| Maximum | 53.8% | 70.0% |
| Range | 49.4% | 65.4% |
| Mean | 22.7% | 28.5% |
| Median | 21.2% | 24.0% |
| Interquartile 25% (IQ1) | 17.9% | 19.4% |
| Interquartile 75% (IQ3) | 25.6% | 34.0% |
| Interquartile Range (IQR) | 7.7% | 14.6% |
| Standard Deviation (Sample) | 9.4% | 14.4% |
| Standard Deviation (Population) | 9.3% | 14.3% |
Similar Demographics by 3 or more Vehicles in Household
Demographics Similar to Serbians by 3 or more Vehicles in Household
In terms of 3 or more vehicles in household, the demographic groups most similar to Serbians are Tsimshian (19.1%, a difference of 0.040%), Immigrants from Moldova (19.1%, a difference of 0.040%), Kenyan (19.1%, a difference of 0.080%), South American Indian (19.1%, a difference of 0.14%), and Immigrants from Zimbabwe (19.1%, a difference of 0.15%).
| Demographics | Rating | Rank | 3 or more Vehicles in Household |
| Immigrants | Hong Kong | 28.3 /100 | #187 | Fair 19.2% |
| Immigrants | Kuwait | 26.1 /100 | #188 | Fair 19.1% |
| Indians (Asian) | 26.0 /100 | #189 | Fair 19.1% |
| Immigrants | Zimbabwe | 25.5 /100 | #190 | Fair 19.1% |
| South American Indians | 25.4 /100 | #191 | Fair 19.1% |
| Kenyans | 24.7 /100 | #192 | Fair 19.1% |
| Tsimshian | 24.4 /100 | #193 | Fair 19.1% |
| Serbians | 24.0 /100 | #194 | Fair 19.1% |
| Immigrants | Moldova | 23.6 /100 | #195 | Fair 19.1% |
| Central American Indians | 22.2 /100 | #196 | Fair 19.0% |
| Immigrants | Japan | 22.0 /100 | #197 | Fair 19.0% |
| Egyptians | 19.5 /100 | #198 | Poor 19.0% |
| Immigrants | Norway | 19.0 /100 | #199 | Poor 19.0% |
| Argentineans | 18.2 /100 | #200 | Poor 18.9% |
| Arabs | 17.7 /100 | #201 | Poor 18.9% |
Demographics Similar to Slavs by 3 or more Vehicles in Household
In terms of 3 or more vehicles in household, the demographic groups most similar to Slavs are Immigrants from Bolivia (20.4%, a difference of 0.030%), New Zealander (20.4%, a difference of 0.20%), Immigrants from Netherlands (20.4%, a difference of 0.21%), Central American (20.5%, a difference of 0.24%), and German Russian (20.5%, a difference of 0.42%).
| Demographics | Rating | Rank | 3 or more Vehicles in Household |
| Immigrants | Latin America | 94.5 /100 | #119 | Exceptional 20.5% |
| Maltese | 93.9 /100 | #120 | Exceptional 20.5% |
| Immigrants | Thailand | 93.8 /100 | #121 | Exceptional 20.5% |
| German Russians | 93.7 /100 | #122 | Exceptional 20.5% |
| Immigrants | Korea | 93.7 /100 | #123 | Exceptional 20.5% |
| Central Americans | 93.1 /100 | #124 | Exceptional 20.5% |
| Immigrants | Netherlands | 92.9 /100 | #125 | Exceptional 20.4% |
| Slavs | 92.1 /100 | #126 | Exceptional 20.4% |
| Immigrants | Bolivia | 92.0 /100 | #127 | Exceptional 20.4% |
| New Zealanders | 91.3 /100 | #128 | Exceptional 20.4% |
| Zimbabweans | 88.7 /100 | #129 | Excellent 20.3% |
| Greeks | 88.6 /100 | #130 | Excellent 20.3% |
| Immigrants | Asia | 88.1 /100 | #131 | Excellent 20.2% |
| Immigrants | Canada | 87.8 /100 | #132 | Excellent 20.2% |
| Immigrants | North America | 87.8 /100 | #133 | Excellent 20.2% |