Serbian vs Slavic Master's Degree
COMPARE
Serbian
Slavic
Master's Degree
Master's Degree Comparison
Serbians
Slavs
16.1%
MASTER'S DEGREE
91.7/ 100
METRIC RATING
132nd/ 347
METRIC RANK
15.5%
MASTER'S DEGREE
77.0/ 100
METRIC RATING
152nd/ 347
METRIC RANK
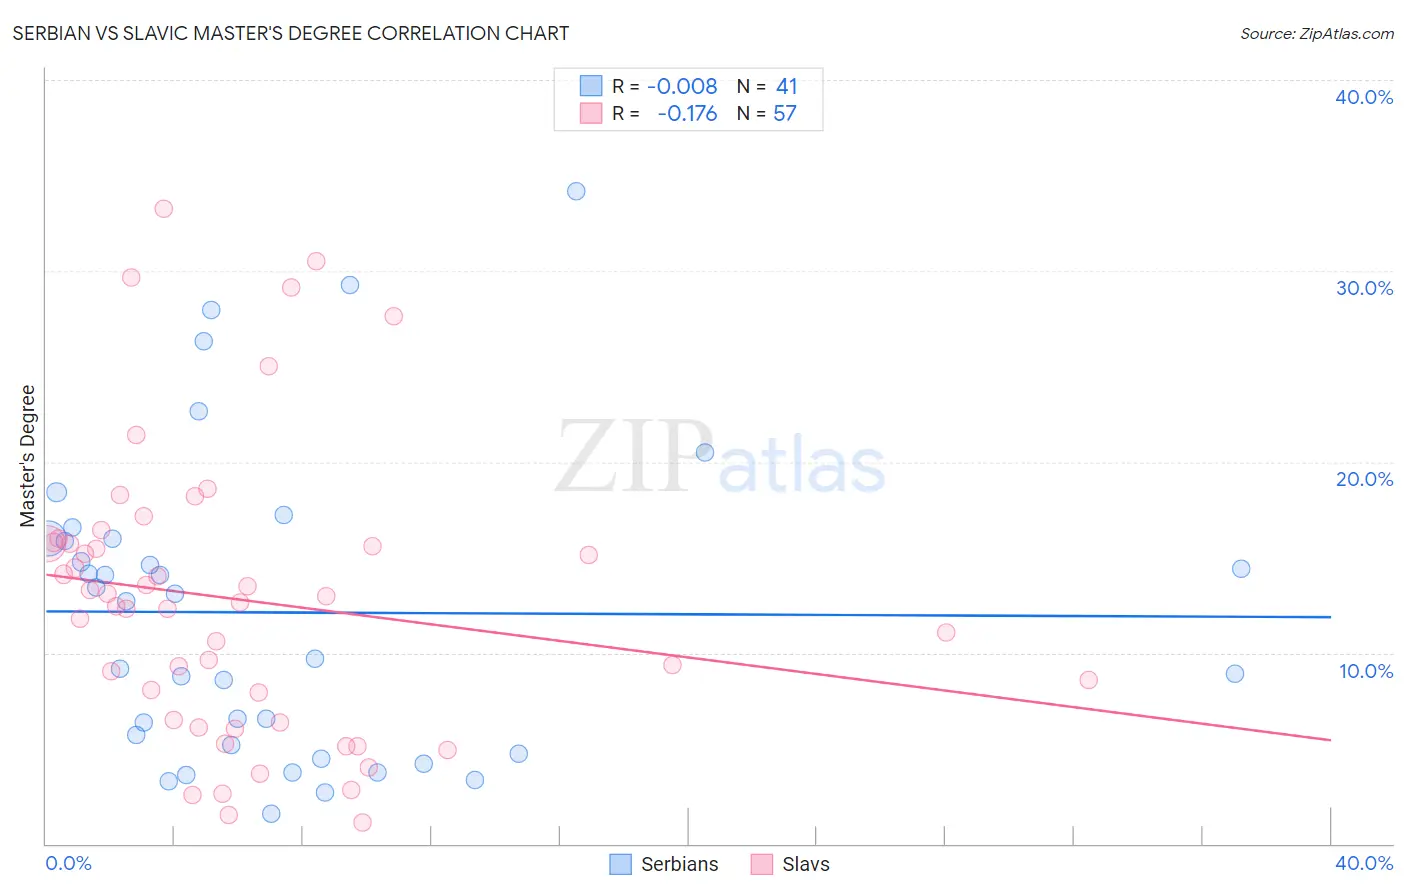
Serbian vs Slavic Master's Degree Correlation Chart
The statistical analysis conducted on geographies consisting of 267,595,845 people shows no correlation between the proportion of Serbians and percentage of population with at least master's degree education in the United States with a correlation coefficient (R) of -0.008 and weighted average of 16.1%. Similarly, the statistical analysis conducted on geographies consisting of 270,833,952 people shows a poor negative correlation between the proportion of Slavs and percentage of population with at least master's degree education in the United States with a correlation coefficient (R) of -0.176 and weighted average of 15.5%, a difference of 3.7%.
Master's Degree Correlation Summary
| Measurement | Serbian | Slavic |
| Minimum | 1.5% | 1.1% |
| Maximum | 34.2% | 33.2% |
| Range | 32.6% | 32.1% |
| Mean | 12.1% | 12.8% |
| Median | 12.7% | 12.6% |
| Interquartile 25% (IQ1) | 5.0% | 6.4% |
| Interquartile 75% (IQ3) | 16.0% | 15.7% |
| Interquartile Range (IQR) | 11.0% | 9.3% |
| Standard Deviation (Sample) | 8.0% | 7.5% |
| Standard Deviation (Population) | 7.9% | 7.5% |
Demographics Similar to Serbians and Slavs by Master's Degree
In terms of master's degree, the demographic groups most similar to Serbians are Immigrants from Sudan (16.0%, a difference of 0.54%), Venezuelan (15.9%, a difference of 1.1%), South American Indian (15.9%, a difference of 1.1%), Assyrian/Chaldean/Syriac (15.8%, a difference of 1.6%), and European (15.8%, a difference of 1.7%). Similarly, the demographic groups most similar to Slavs are Iraqi (15.5%, a difference of 0.050%), Slovene (15.5%, a difference of 0.17%), Immigrants from Senegal (15.5%, a difference of 0.21%), Ghanaian (15.5%, a difference of 0.21%), and Hungarian (15.6%, a difference of 0.38%).
| Demographics | Rating | Rank | Master's Degree |
| Serbians | 91.7 /100 | #132 | Exceptional 16.1% |
| Immigrants | Sudan | 90.2 /100 | #133 | Exceptional 16.0% |
| Venezuelans | 88.4 /100 | #134 | Excellent 15.9% |
| South American Indians | 88.4 /100 | #135 | Excellent 15.9% |
| Assyrians/Chaldeans/Syriacs | 86.8 /100 | #136 | Excellent 15.8% |
| Europeans | 86.4 /100 | #137 | Excellent 15.8% |
| Pakistanis | 86.1 /100 | #138 | Excellent 15.8% |
| Immigrants | Germany | 85.9 /100 | #139 | Excellent 15.8% |
| Vietnamese | 85.5 /100 | #140 | Excellent 15.8% |
| Poles | 85.0 /100 | #141 | Excellent 15.7% |
| Immigrants | Africa | 84.0 /100 | #142 | Excellent 15.7% |
| Immigrants | Venezuela | 83.6 /100 | #143 | Excellent 15.7% |
| Canadians | 83.3 /100 | #144 | Excellent 15.7% |
| South Americans | 81.3 /100 | #145 | Excellent 15.6% |
| Immigrants | Afghanistan | 79.4 /100 | #146 | Good 15.6% |
| Hungarians | 79.1 /100 | #147 | Good 15.6% |
| Immigrants | Senegal | 78.2 /100 | #148 | Good 15.5% |
| Ghanaians | 78.2 /100 | #149 | Good 15.5% |
| Slovenes | 78.0 /100 | #150 | Good 15.5% |
| Iraqis | 77.3 /100 | #151 | Good 15.5% |
| Slavs | 77.0 /100 | #152 | Good 15.5% |