Serbian vs Immigrants from Australia Cognitive Disability
COMPARE
Serbian
Immigrants from Australia
Cognitive Disability
Cognitive Disability Comparison
Serbians
Immigrants from Australia
16.7%
COGNITIVE DISABILITY
99.1/ 100
METRIC RATING
83rd/ 347
METRIC RANK
17.1%
COGNITIVE DISABILITY
76.0/ 100
METRIC RATING
157th/ 347
METRIC RANK
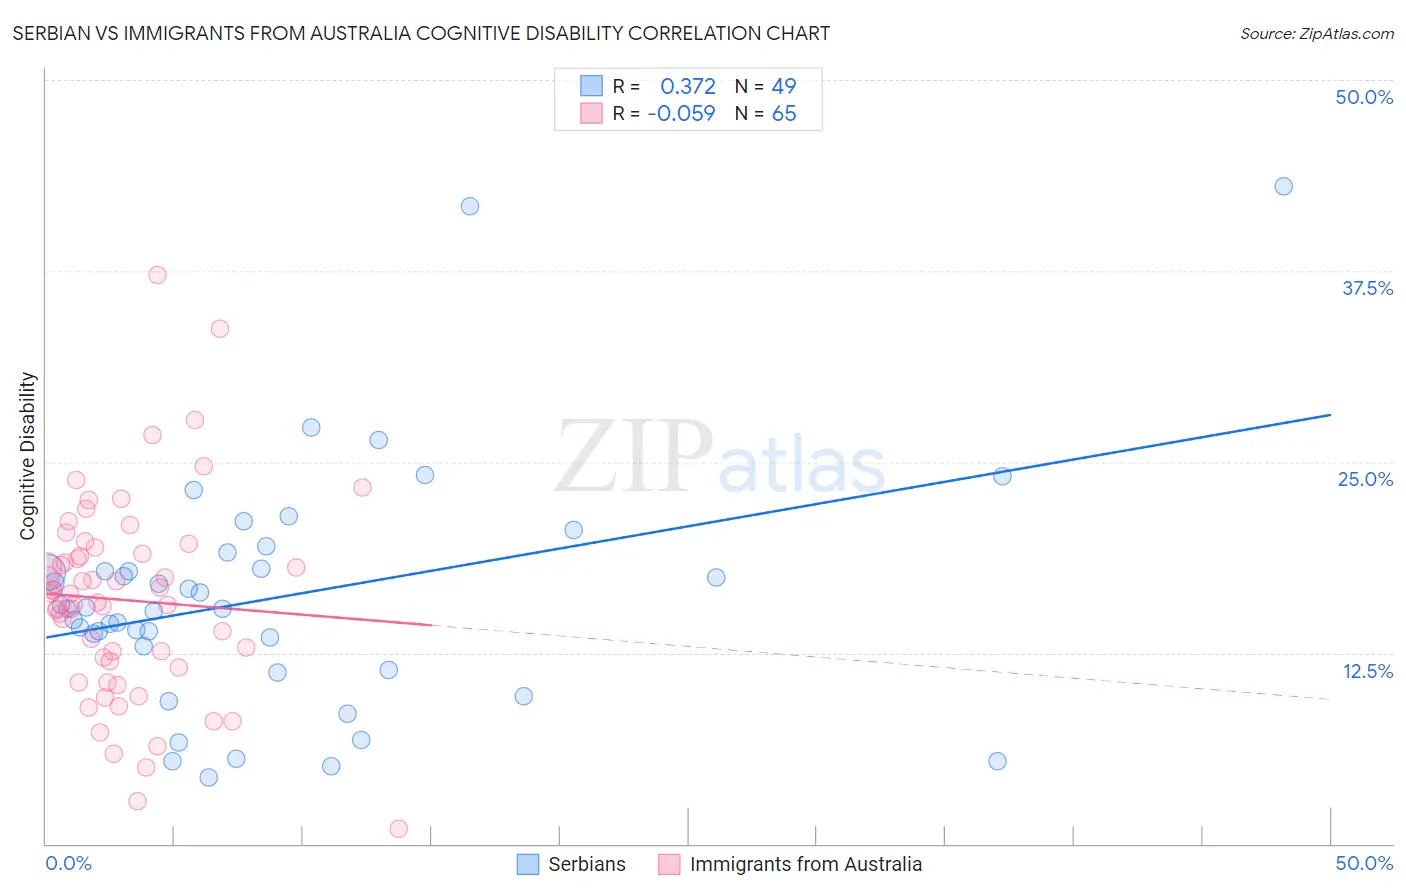
Serbian vs Immigrants from Australia Cognitive Disability Correlation Chart
The statistical analysis conducted on geographies consisting of 267,644,527 people shows a mild positive correlation between the proportion of Serbians and percentage of population with cognitive disability in the United States with a correlation coefficient (R) of 0.372 and weighted average of 16.7%. Similarly, the statistical analysis conducted on geographies consisting of 227,201,073 people shows a slight negative correlation between the proportion of Immigrants from Australia and percentage of population with cognitive disability in the United States with a correlation coefficient (R) of -0.059 and weighted average of 17.1%, a difference of 2.6%.
Cognitive Disability Correlation Summary
| Measurement | Serbian | Immigrants from Australia |
| Minimum | 4.3% | 0.98% |
| Maximum | 43.1% | 37.3% |
| Range | 38.7% | 36.3% |
| Mean | 16.1% | 15.9% |
| Median | 15.4% | 16.4% |
| Interquartile 25% (IQ1) | 12.1% | 11.8% |
| Interquartile 75% (IQ3) | 18.6% | 19.2% |
| Interquartile Range (IQR) | 6.4% | 7.4% |
| Standard Deviation (Sample) | 7.8% | 6.6% |
| Standard Deviation (Population) | 7.7% | 6.5% |
Similar Demographics by Cognitive Disability
Demographics Similar to Serbians by Cognitive Disability
In terms of cognitive disability, the demographic groups most similar to Serbians are Belgian (16.7%, a difference of 0.020%), Immigrants from Moldova (16.7%, a difference of 0.030%), Swiss (16.7%, a difference of 0.070%), Immigrants from South Africa (16.7%, a difference of 0.070%), and Native Hawaiian (16.7%, a difference of 0.080%).
| Demographics | Rating | Rank | Cognitive Disability |
| Immigrants | Serbia | 99.3 /100 | #76 | Exceptional 16.7% |
| Immigrants | Hungary | 99.3 /100 | #77 | Exceptional 16.7% |
| Peruvians | 99.3 /100 | #78 | Exceptional 16.7% |
| Immigrants | Bulgaria | 99.3 /100 | #79 | Exceptional 16.7% |
| Egyptians | 99.2 /100 | #80 | Exceptional 16.7% |
| Immigrants | Netherlands | 99.2 /100 | #81 | Exceptional 16.7% |
| Swiss | 99.2 /100 | #82 | Exceptional 16.7% |
| Serbians | 99.1 /100 | #83 | Exceptional 16.7% |
| Belgians | 99.1 /100 | #84 | Exceptional 16.7% |
| Immigrants | Moldova | 99.1 /100 | #85 | Exceptional 16.7% |
| Immigrants | South Africa | 99.0 /100 | #86 | Exceptional 16.7% |
| Native Hawaiians | 99.0 /100 | #87 | Exceptional 16.7% |
| Immigrants | Philippines | 99.0 /100 | #88 | Exceptional 16.7% |
| Immigrants | Egypt | 98.8 /100 | #89 | Exceptional 16.7% |
| South Americans | 98.8 /100 | #90 | Exceptional 16.7% |
Demographics Similar to Immigrants from Australia by Cognitive Disability
In terms of cognitive disability, the demographic groups most similar to Immigrants from Australia are Celtic (17.1%, a difference of 0.070%), Immigrants from Latvia (17.2%, a difference of 0.11%), Brazilian (17.1%, a difference of 0.12%), Sri Lankan (17.1%, a difference of 0.12%), and Immigrants from Malaysia (17.1%, a difference of 0.14%).
| Demographics | Rating | Rank | Cognitive Disability |
| Basques | 85.5 /100 | #150 | Excellent 17.1% |
| Syrians | 83.0 /100 | #151 | Excellent 17.1% |
| Immigrants | Indonesia | 82.7 /100 | #152 | Excellent 17.1% |
| Immigrants | Kazakhstan | 80.5 /100 | #153 | Excellent 17.1% |
| Immigrants | Malaysia | 79.3 /100 | #154 | Good 17.1% |
| Brazilians | 78.9 /100 | #155 | Good 17.1% |
| Sri Lankans | 78.9 /100 | #156 | Good 17.1% |
| Immigrants | Australia | 76.0 /100 | #157 | Good 17.1% |
| Celtics | 74.1 /100 | #158 | Good 17.1% |
| Immigrants | Latvia | 73.2 /100 | #159 | Good 17.2% |
| Australians | 72.4 /100 | #160 | Good 17.2% |
| Americans | 72.2 /100 | #161 | Good 17.2% |
| Yugoslavians | 71.6 /100 | #162 | Good 17.2% |
| Immigrants | Switzerland | 71.5 /100 | #163 | Good 17.2% |
| Armenians | 70.1 /100 | #164 | Good 17.2% |