Serbian vs Immigrants from Canada 4 or more Vehicles in Household
COMPARE
Serbian
Immigrants from Canada
4 or more Vehicles in Household
4 or more Vehicles in Household Comparison
Serbians
Immigrants from Canada
6.0%
4 OR MORE VEHICLES IN HOUSEHOLD
11.0/ 100
METRIC RATING
219th/ 347
METRIC RANK
6.5%
4 OR MORE VEHICLES IN HOUSEHOLD
78.6/ 100
METRIC RATING
143rd/ 347
METRIC RANK
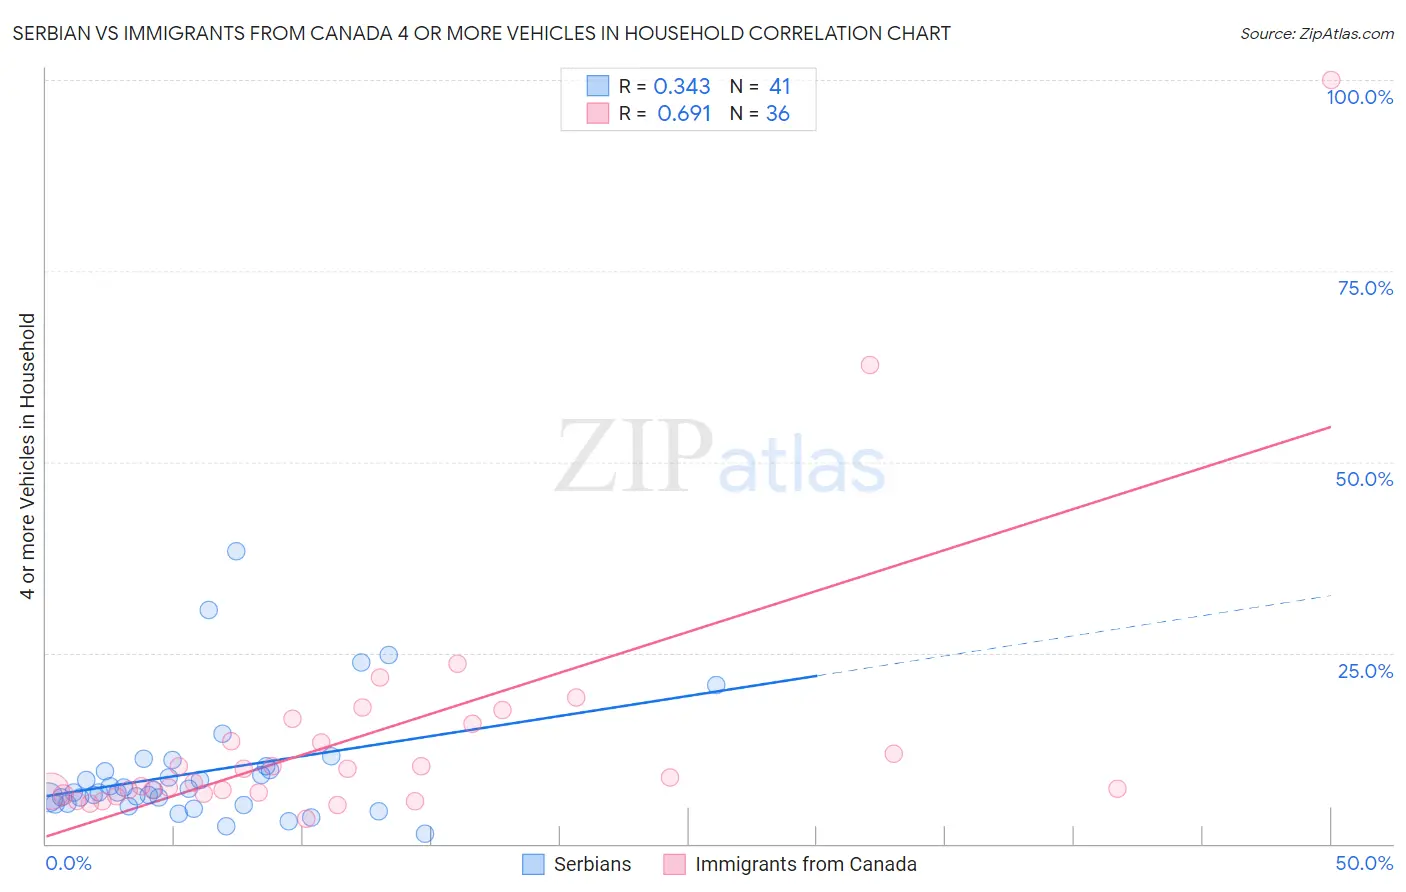
Serbian vs Immigrants from Canada 4 or more Vehicles in Household Correlation Chart
The statistical analysis conducted on geographies consisting of 266,656,513 people shows a mild positive correlation between the proportion of Serbians and percentage of households with 4 or more vehicles available in the United States with a correlation coefficient (R) of 0.343 and weighted average of 6.0%. Similarly, the statistical analysis conducted on geographies consisting of 457,196,725 people shows a significant positive correlation between the proportion of Immigrants from Canada and percentage of households with 4 or more vehicles available in the United States with a correlation coefficient (R) of 0.691 and weighted average of 6.5%, a difference of 9.1%.
4 or more Vehicles in Household Correlation Summary
| Measurement | Serbian | Immigrants from Canada |
| Minimum | 1.2% | 3.3% |
| Maximum | 38.2% | 100.0% |
| Range | 37.0% | 96.7% |
| Mean | 9.4% | 14.1% |
| Median | 6.7% | 8.4% |
| Interquartile 25% (IQ1) | 5.2% | 6.7% |
| Interquartile 75% (IQ3) | 10.0% | 14.6% |
| Interquartile Range (IQR) | 4.7% | 7.9% |
| Standard Deviation (Sample) | 7.7% | 17.9% |
| Standard Deviation (Population) | 7.6% | 17.6% |
Similar Demographics by 4 or more Vehicles in Household
Demographics Similar to Serbians by 4 or more Vehicles in Household
In terms of 4 or more vehicles in household, the demographic groups most similar to Serbians are Immigrants from Italy (6.0%, a difference of 0.0%), Russian (6.0%, a difference of 0.19%), Nigerian (6.0%, a difference of 0.31%), Immigrants from Moldova (6.0%, a difference of 0.49%), and Cajun (6.0%, a difference of 0.52%).
| Demographics | Rating | Rank | 4 or more Vehicles in Household |
| Immigrants | Egypt | 14.7 /100 | #212 | Poor 6.0% |
| Arabs | 14.4 /100 | #213 | Poor 6.0% |
| Immigrants | Austria | 14.3 /100 | #214 | Poor 6.0% |
| Immigrants | China | 13.8 /100 | #215 | Poor 6.0% |
| Immigrants | Romania | 13.8 /100 | #216 | Poor 6.0% |
| Nigerians | 12.2 /100 | #217 | Poor 6.0% |
| Immigrants | Italy | 11.0 /100 | #218 | Poor 6.0% |
| Serbians | 11.0 /100 | #219 | Poor 6.0% |
| Russians | 10.3 /100 | #220 | Poor 6.0% |
| Immigrants | Moldova | 9.3 /100 | #221 | Tragic 6.0% |
| Cajuns | 9.2 /100 | #222 | Tragic 6.0% |
| Immigrants | Kenya | 9.2 /100 | #223 | Tragic 6.0% |
| Cubans | 9.2 /100 | #224 | Tragic 6.0% |
| Indonesians | 8.9 /100 | #225 | Tragic 6.0% |
| Immigrants | Singapore | 7.9 /100 | #226 | Tragic 5.9% |
Demographics Similar to Immigrants from Canada by 4 or more Vehicles in Household
In terms of 4 or more vehicles in household, the demographic groups most similar to Immigrants from Canada are Immigrants from North America (6.5%, a difference of 0.020%), Croatian (6.5%, a difference of 0.11%), Immigrants from Iraq (6.5%, a difference of 0.13%), Australian (6.6%, a difference of 0.33%), and Slavic (6.6%, a difference of 0.46%).
| Demographics | Rating | Rank | 4 or more Vehicles in Household |
| Luxembourgers | 86.4 /100 | #136 | Excellent 6.6% |
| French Canadians | 85.4 /100 | #137 | Excellent 6.6% |
| Italians | 84.5 /100 | #138 | Excellent 6.6% |
| Jordanians | 82.1 /100 | #139 | Excellent 6.6% |
| Slavs | 81.6 /100 | #140 | Excellent 6.6% |
| Australians | 80.8 /100 | #141 | Excellent 6.6% |
| Immigrants | Iraq | 79.4 /100 | #142 | Good 6.5% |
| Immigrants | Canada | 78.6 /100 | #143 | Good 6.5% |
| Immigrants | North America | 78.5 /100 | #144 | Good 6.5% |
| Croatians | 77.8 /100 | #145 | Good 6.5% |
| Immigrants | Costa Rica | 74.4 /100 | #146 | Good 6.5% |
| Immigrants | Iran | 73.9 /100 | #147 | Good 6.5% |
| Immigrants | Jordan | 73.7 /100 | #148 | Good 6.5% |
| Greeks | 73.6 /100 | #149 | Good 6.5% |
| New Zealanders | 73.3 /100 | #150 | Good 6.5% |