Serbian vs Immigrants from Australia Seniors Poverty Over the Age of 75
COMPARE
Serbian
Immigrants from Australia
Seniors Poverty Over the Age of 75
Seniors Poverty Over the Age of 75 Comparison
Serbians
Immigrants from Australia
11.1%
SENIORS POVERTY OVER THE AGE OF 75
98.6/ 100
METRIC RATING
50th/ 347
METRIC RANK
12.2%
SENIORS POVERTY OVER THE AGE OF 75
44.2/ 100
METRIC RATING
181st/ 347
METRIC RANK
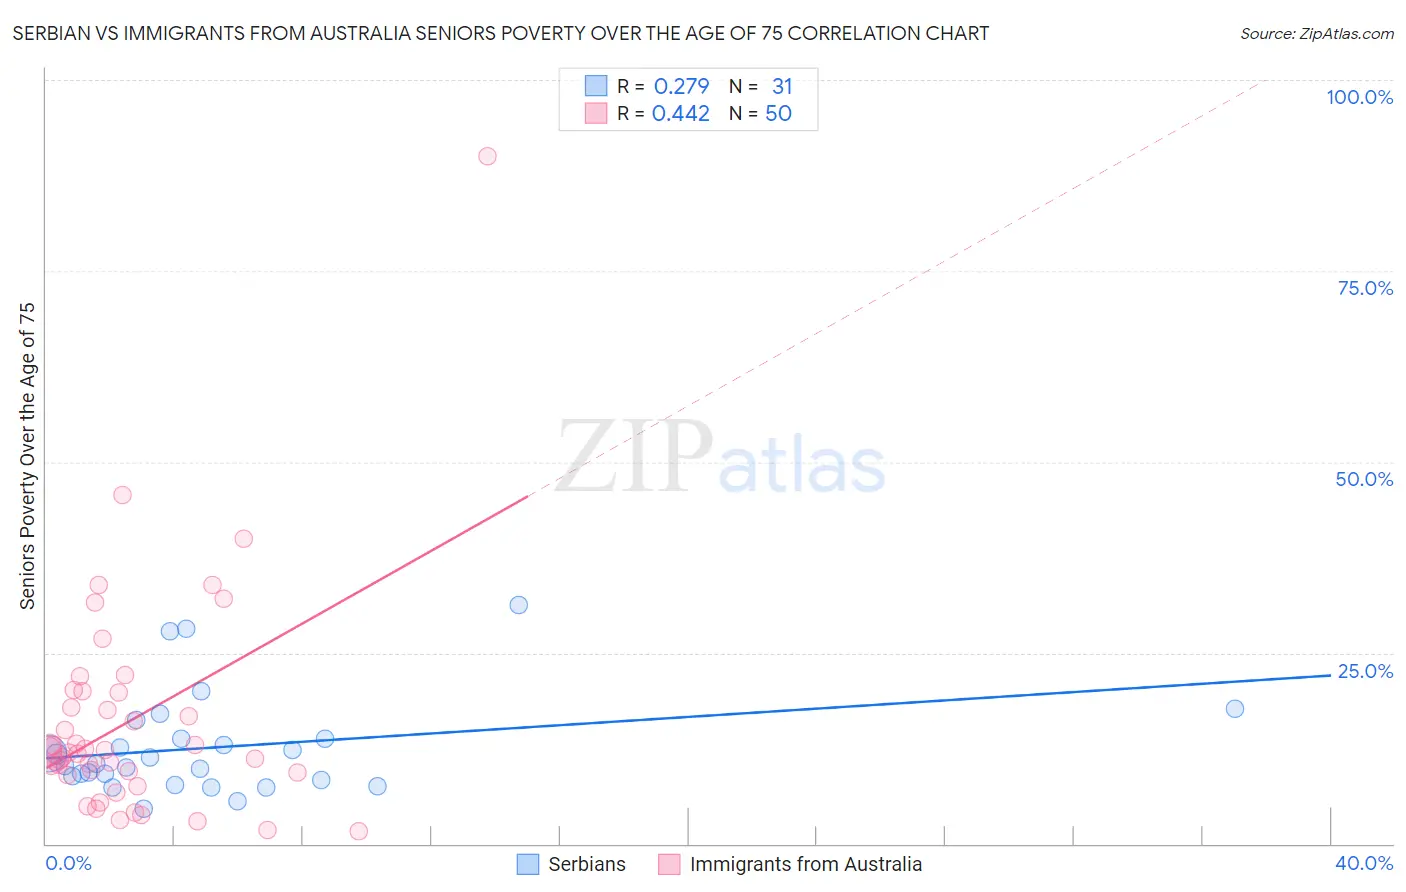
Serbian vs Immigrants from Australia Seniors Poverty Over the Age of 75 Correlation Chart
The statistical analysis conducted on geographies consisting of 265,638,008 people shows a weak positive correlation between the proportion of Serbians and poverty level among seniors over the age of 75 in the United States with a correlation coefficient (R) of 0.279 and weighted average of 11.1%. Similarly, the statistical analysis conducted on geographies consisting of 225,278,239 people shows a moderate positive correlation between the proportion of Immigrants from Australia and poverty level among seniors over the age of 75 in the United States with a correlation coefficient (R) of 0.442 and weighted average of 12.2%, a difference of 10.0%.
Seniors Poverty Over the Age of 75 Correlation Summary
| Measurement | Serbian | Immigrants from Australia |
| Minimum | 4.6% | 1.7% |
| Maximum | 31.2% | 90.0% |
| Range | 26.6% | 88.3% |
| Mean | 12.6% | 16.1% |
| Median | 10.4% | 12.0% |
| Interquartile 25% (IQ1) | 8.3% | 9.3% |
| Interquartile 75% (IQ3) | 13.8% | 19.8% |
| Interquartile Range (IQR) | 5.5% | 10.5% |
| Standard Deviation (Sample) | 6.5% | 14.6% |
| Standard Deviation (Population) | 6.4% | 14.4% |
Similar Demographics by Seniors Poverty Over the Age of 75
Demographics Similar to Serbians by Seniors Poverty Over the Age of 75
In terms of seniors poverty over the age of 75, the demographic groups most similar to Serbians are Immigrants from North Macedonia (11.1%, a difference of 0.030%), Samoan (11.1%, a difference of 0.11%), Zimbabwean (11.2%, a difference of 0.18%), French (11.1%, a difference of 0.22%), and Immigrants from England (11.2%, a difference of 0.25%).
| Demographics | Rating | Rank | Seniors Poverty Over the Age of 75 |
| Celtics | 99.1 /100 | #43 | Exceptional 11.0% |
| Belgians | 99.1 /100 | #44 | Exceptional 11.0% |
| Carpatho Rusyns | 99.0 /100 | #45 | Exceptional 11.1% |
| Greeks | 99.0 /100 | #46 | Exceptional 11.1% |
| Hawaiians | 98.8 /100 | #47 | Exceptional 11.1% |
| French | 98.7 /100 | #48 | Exceptional 11.1% |
| Samoans | 98.7 /100 | #49 | Exceptional 11.1% |
| Serbians | 98.6 /100 | #50 | Exceptional 11.1% |
| Immigrants | North Macedonia | 98.6 /100 | #51 | Exceptional 11.1% |
| Zimbabweans | 98.5 /100 | #52 | Exceptional 11.2% |
| Immigrants | England | 98.4 /100 | #53 | Exceptional 11.2% |
| Afghans | 98.2 /100 | #54 | Exceptional 11.2% |
| Hungarians | 98.1 /100 | #55 | Exceptional 11.2% |
| Slavs | 98.1 /100 | #56 | Exceptional 11.2% |
| Immigrants | Canada | 97.9 /100 | #57 | Exceptional 11.2% |
Demographics Similar to Immigrants from Australia by Seniors Poverty Over the Age of 75
In terms of seniors poverty over the age of 75, the demographic groups most similar to Immigrants from Australia are Immigrants from South Eastern Asia (12.2%, a difference of 0.010%), Mongolian (12.2%, a difference of 0.11%), Nonimmigrants (12.2%, a difference of 0.22%), German Russian (12.3%, a difference of 0.23%), and Immigrants from Asia (12.2%, a difference of 0.30%).
| Demographics | Rating | Rank | Seniors Poverty Over the Age of 75 |
| Immigrants | Europe | 50.0 /100 | #174 | Average 12.2% |
| Immigrants | Saudi Arabia | 49.5 /100 | #175 | Average 12.2% |
| Immigrants | Iran | 48.1 /100 | #176 | Average 12.2% |
| Immigrants | Asia | 47.8 /100 | #177 | Average 12.2% |
| Immigrants | Nonimmigrants | 46.8 /100 | #178 | Average 12.2% |
| Mongolians | 45.5 /100 | #179 | Average 12.2% |
| Immigrants | South Eastern Asia | 44.3 /100 | #180 | Average 12.2% |
| Immigrants | Australia | 44.2 /100 | #181 | Average 12.2% |
| German Russians | 41.4 /100 | #182 | Average 12.3% |
| Laotians | 38.2 /100 | #183 | Fair 12.3% |
| Kiowa | 36.0 /100 | #184 | Fair 12.3% |
| Immigrants | Malaysia | 35.8 /100 | #185 | Fair 12.3% |
| Sri Lankans | 32.3 /100 | #186 | Fair 12.4% |
| Yaqui | 25.9 /100 | #187 | Fair 12.5% |
| Immigrants | Northern Africa | 25.2 /100 | #188 | Fair 12.5% |