Seminole vs Immigrants from Albania 1 or more Vehicles in Household
COMPARE
Seminole
Immigrants from Albania
1 or more Vehicles in Household
1 or more Vehicles in Household Comparison
Seminole
Immigrants from Albania
91.1%
1 OR MORE VEHICLES IN HOUSEHOLD
98.3/ 100
METRIC RATING
102nd/ 347
METRIC RANK
87.1%
1 OR MORE VEHICLES IN HOUSEHOLD
0.1/ 100
METRIC RATING
279th/ 347
METRIC RANK
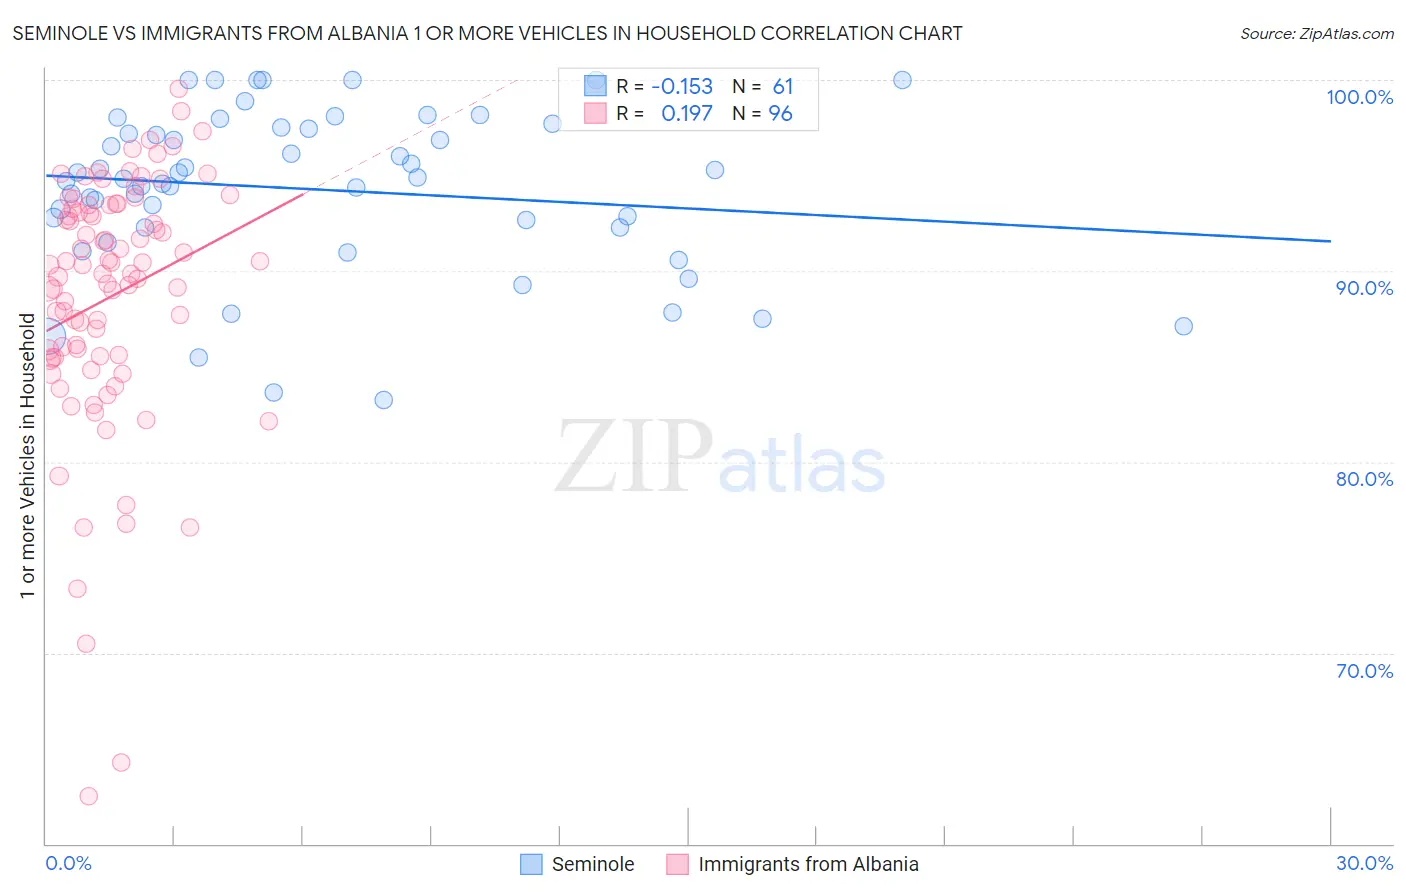
Seminole vs Immigrants from Albania 1 or more Vehicles in Household Correlation Chart
The statistical analysis conducted on geographies consisting of 118,307,122 people shows a poor negative correlation between the proportion of Seminole and percentage of households with 1 or more vehicles available in the United States with a correlation coefficient (R) of -0.153 and weighted average of 91.1%. Similarly, the statistical analysis conducted on geographies consisting of 107,656,140 people shows a poor positive correlation between the proportion of Immigrants from Albania and percentage of households with 1 or more vehicles available in the United States with a correlation coefficient (R) of 0.197 and weighted average of 87.1%, a difference of 4.7%.
1 or more Vehicles in Household Correlation Summary
| Measurement | Seminole | Immigrants from Albania |
| Minimum | 83.2% | 62.5% |
| Maximum | 100.0% | 99.5% |
| Range | 16.8% | 37.0% |
| Mean | 94.3% | 88.6% |
| Median | 94.8% | 90.1% |
| Interquartile 25% (IQ1) | 92.3% | 85.5% |
| Interquartile 75% (IQ3) | 97.5% | 93.3% |
| Interquartile Range (IQR) | 5.2% | 7.8% |
| Standard Deviation (Sample) | 4.2% | 6.7% |
| Standard Deviation (Population) | 4.2% | 6.7% |
Similar Demographics by 1 or more Vehicles in Household
Demographics Similar to Seminole by 1 or more Vehicles in Household
In terms of 1 or more vehicles in household, the demographic groups most similar to Seminole are Yugoslavian (91.1%, a difference of 0.010%), Bulgarian (91.1%, a difference of 0.020%), Asian (91.1%, a difference of 0.020%), Immigrants from Central America (91.1%, a difference of 0.030%), and Immigrants from Bolivia (91.2%, a difference of 0.070%).
| Demographics | Rating | Rank | 1 or more Vehicles in Household |
| Austrians | 99.0 /100 | #95 | Exceptional 91.3% |
| Potawatomi | 99.0 /100 | #96 | Exceptional 91.3% |
| Pakistanis | 99.0 /100 | #97 | Exceptional 91.3% |
| Slavs | 98.7 /100 | #98 | Exceptional 91.2% |
| Immigrants | Bolivia | 98.6 /100 | #99 | Exceptional 91.2% |
| Immigrants | Central America | 98.4 /100 | #100 | Exceptional 91.1% |
| Bulgarians | 98.4 /100 | #101 | Exceptional 91.1% |
| Seminole | 98.3 /100 | #102 | Exceptional 91.1% |
| Yugoslavians | 98.3 /100 | #103 | Exceptional 91.1% |
| Asians | 98.2 /100 | #104 | Exceptional 91.1% |
| Laotians | 98.0 /100 | #105 | Exceptional 91.0% |
| Zimbabweans | 97.7 /100 | #106 | Exceptional 91.0% |
| Maltese | 97.7 /100 | #107 | Exceptional 91.0% |
| Hispanics or Latinos | 97.6 /100 | #108 | Exceptional 91.0% |
| Delaware | 97.6 /100 | #109 | Exceptional 91.0% |
Demographics Similar to Immigrants from Albania by 1 or more Vehicles in Household
In terms of 1 or more vehicles in household, the demographic groups most similar to Immigrants from Albania are Immigrants from Southern Europe (87.1%, a difference of 0.0%), Immigrants from Croatia (87.0%, a difference of 0.030%), Alsatian (87.1%, a difference of 0.040%), Mongolian (87.0%, a difference of 0.090%), and Immigrants from France (87.1%, a difference of 0.10%).
| Demographics | Rating | Rank | 1 or more Vehicles in Household |
| Aleuts | 0.2 /100 | #272 | Tragic 87.5% |
| Immigrants | Northern Africa | 0.2 /100 | #273 | Tragic 87.4% |
| Immigrants | Morocco | 0.1 /100 | #274 | Tragic 87.4% |
| Immigrants | Singapore | 0.1 /100 | #275 | Tragic 87.2% |
| Immigrants | France | 0.1 /100 | #276 | Tragic 87.1% |
| Alsatians | 0.1 /100 | #277 | Tragic 87.1% |
| Immigrants | Southern Europe | 0.1 /100 | #278 | Tragic 87.1% |
| Immigrants | Albania | 0.1 /100 | #279 | Tragic 87.1% |
| Immigrants | Croatia | 0.0 /100 | #280 | Tragic 87.0% |
| Mongolians | 0.0 /100 | #281 | Tragic 87.0% |
| Colville | 0.0 /100 | #282 | Tragic 86.8% |
| Immigrants | Eastern Europe | 0.0 /100 | #283 | Tragic 86.7% |
| Central American Indians | 0.0 /100 | #284 | Tragic 86.7% |
| Immigrants | Kazakhstan | 0.0 /100 | #285 | Tragic 86.6% |
| Immigrants | Eastern Asia | 0.0 /100 | #286 | Tragic 86.5% |