Seminole vs Immigrants from Ecuador 1 or more Vehicles in Household
COMPARE
Seminole
Immigrants from Ecuador
1 or more Vehicles in Household
1 or more Vehicles in Household Comparison
Seminole
Immigrants from Ecuador
91.1%
1 OR MORE VEHICLES IN HOUSEHOLD
98.3/ 100
METRIC RATING
102nd/ 347
METRIC RANK
76.2%
1 OR MORE VEHICLES IN HOUSEHOLD
0.0/ 100
METRIC RATING
333rd/ 347
METRIC RANK
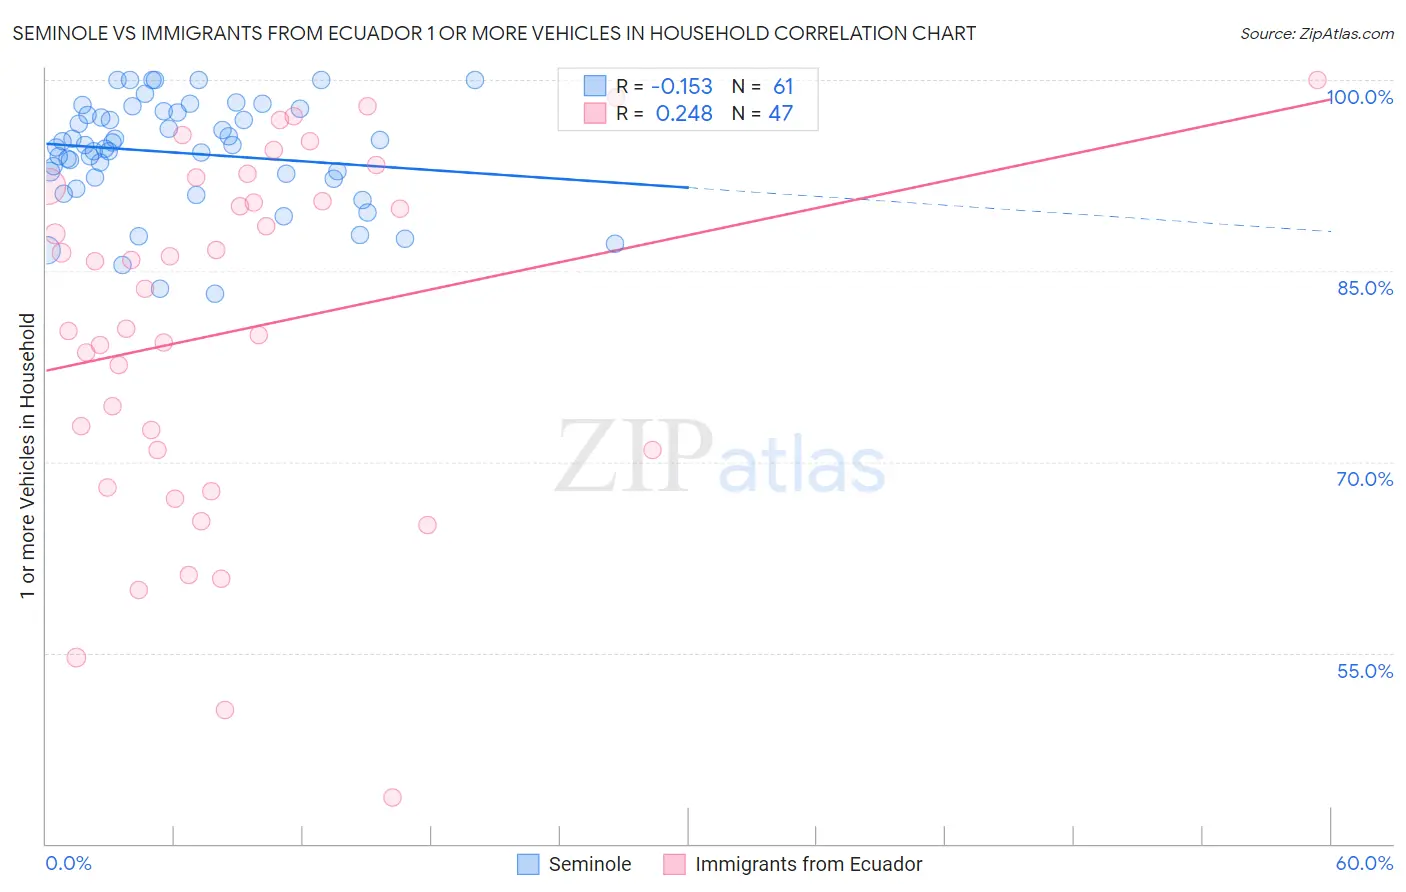
Seminole vs Immigrants from Ecuador 1 or more Vehicles in Household Correlation Chart
The statistical analysis conducted on geographies consisting of 118,307,122 people shows a poor negative correlation between the proportion of Seminole and percentage of households with 1 or more vehicles available in the United States with a correlation coefficient (R) of -0.153 and weighted average of 91.1%. Similarly, the statistical analysis conducted on geographies consisting of 270,903,190 people shows a weak positive correlation between the proportion of Immigrants from Ecuador and percentage of households with 1 or more vehicles available in the United States with a correlation coefficient (R) of 0.248 and weighted average of 76.2%, a difference of 19.5%.
1 or more Vehicles in Household Correlation Summary
| Measurement | Seminole | Immigrants from Ecuador |
| Minimum | 83.2% | 43.6% |
| Maximum | 100.0% | 100.0% |
| Range | 16.8% | 56.4% |
| Mean | 94.3% | 80.4% |
| Median | 94.8% | 83.6% |
| Interquartile 25% (IQ1) | 92.3% | 70.9% |
| Interquartile 75% (IQ3) | 97.5% | 91.7% |
| Interquartile Range (IQR) | 5.2% | 20.7% |
| Standard Deviation (Sample) | 4.2% | 13.9% |
| Standard Deviation (Population) | 4.2% | 13.7% |
Similar Demographics by 1 or more Vehicles in Household
Demographics Similar to Seminole by 1 or more Vehicles in Household
In terms of 1 or more vehicles in household, the demographic groups most similar to Seminole are Yugoslavian (91.1%, a difference of 0.010%), Bulgarian (91.1%, a difference of 0.020%), Asian (91.1%, a difference of 0.020%), Immigrants from Central America (91.1%, a difference of 0.030%), and Immigrants from Bolivia (91.2%, a difference of 0.070%).
| Demographics | Rating | Rank | 1 or more Vehicles in Household |
| Austrians | 99.0 /100 | #95 | Exceptional 91.3% |
| Potawatomi | 99.0 /100 | #96 | Exceptional 91.3% |
| Pakistanis | 99.0 /100 | #97 | Exceptional 91.3% |
| Slavs | 98.7 /100 | #98 | Exceptional 91.2% |
| Immigrants | Bolivia | 98.6 /100 | #99 | Exceptional 91.2% |
| Immigrants | Central America | 98.4 /100 | #100 | Exceptional 91.1% |
| Bulgarians | 98.4 /100 | #101 | Exceptional 91.1% |
| Seminole | 98.3 /100 | #102 | Exceptional 91.1% |
| Yugoslavians | 98.3 /100 | #103 | Exceptional 91.1% |
| Asians | 98.2 /100 | #104 | Exceptional 91.1% |
| Laotians | 98.0 /100 | #105 | Exceptional 91.0% |
| Zimbabweans | 97.7 /100 | #106 | Exceptional 91.0% |
| Maltese | 97.7 /100 | #107 | Exceptional 91.0% |
| Hispanics or Latinos | 97.6 /100 | #108 | Exceptional 91.0% |
| Delaware | 97.6 /100 | #109 | Exceptional 91.0% |
Demographics Similar to Immigrants from Ecuador by 1 or more Vehicles in Household
In terms of 1 or more vehicles in household, the demographic groups most similar to Immigrants from Ecuador are Trinidadian and Tobagonian (76.3%, a difference of 0.10%), West Indian (76.4%, a difference of 0.18%), Immigrants from Trinidad and Tobago (76.8%, a difference of 0.73%), Immigrants from Dominica (77.8%, a difference of 2.1%), and Ecuadorian (77.9%, a difference of 2.2%).
| Demographics | Rating | Rank | 1 or more Vehicles in Household |
| Immigrants | West Indies | 0.0 /100 | #326 | Tragic 79.5% |
| Immigrants | Senegal | 0.0 /100 | #327 | Tragic 79.0% |
| Ecuadorians | 0.0 /100 | #328 | Tragic 77.9% |
| Immigrants | Dominica | 0.0 /100 | #329 | Tragic 77.8% |
| Immigrants | Trinidad and Tobago | 0.0 /100 | #330 | Tragic 76.8% |
| West Indians | 0.0 /100 | #331 | Tragic 76.4% |
| Trinidadians and Tobagonians | 0.0 /100 | #332 | Tragic 76.3% |
| Immigrants | Ecuador | 0.0 /100 | #333 | Tragic 76.2% |
| Immigrants | Bangladesh | 0.0 /100 | #334 | Tragic 74.3% |
| Barbadians | 0.0 /100 | #335 | Tragic 74.0% |
| Vietnamese | 0.0 /100 | #336 | Tragic 73.8% |
| Immigrants | Uzbekistan | 0.0 /100 | #337 | Tragic 73.4% |
| Inupiat | 0.0 /100 | #338 | Tragic 71.5% |
| Guyanese | 0.0 /100 | #339 | Tragic 70.8% |
| Dominicans | 0.0 /100 | #340 | Tragic 70.7% |