Scottish vs Central American Indian Single Father Poverty
COMPARE
Scottish
Central American Indian
Single Father Poverty
Single Father Poverty Comparison
Scottish
Central American Indians
17.7%
SINGLE FATHER POVERTY
0.0/ 100
METRIC RATING
280th/ 347
METRIC RANK
21.7%
SINGLE FATHER POVERTY
0.0/ 100
METRIC RATING
331st/ 347
METRIC RANK
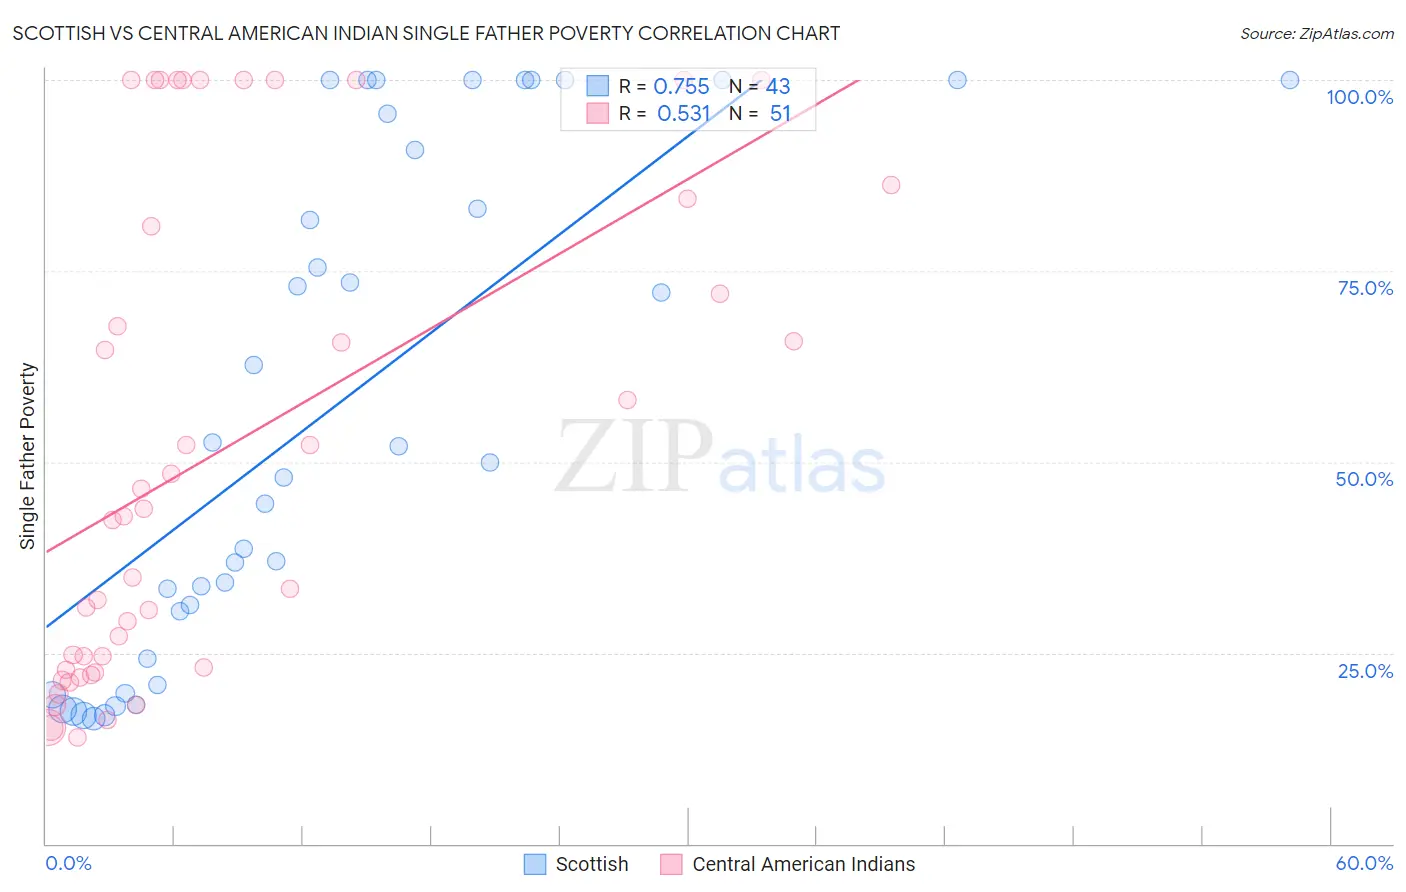
Scottish vs Central American Indian Single Father Poverty Correlation Chart
The statistical analysis conducted on geographies consisting of 405,098,352 people shows a strong positive correlation between the proportion of Scottish and poverty level among single fathers in the United States with a correlation coefficient (R) of 0.755 and weighted average of 17.7%. Similarly, the statistical analysis conducted on geographies consisting of 271,383,000 people shows a substantial positive correlation between the proportion of Central American Indians and poverty level among single fathers in the United States with a correlation coefficient (R) of 0.531 and weighted average of 21.7%, a difference of 22.2%.
Single Father Poverty Correlation Summary
| Measurement | Scottish | Central American Indian |
| Minimum | 16.4% | 13.9% |
| Maximum | 100.0% | 100.0% |
| Range | 83.6% | 86.1% |
| Mean | 56.6% | 51.7% |
| Median | 50.0% | 42.9% |
| Interquartile 25% (IQ1) | 24.3% | 22.7% |
| Interquartile 75% (IQ3) | 95.6% | 84.4% |
| Interquartile Range (IQR) | 71.3% | 61.6% |
| Standard Deviation (Sample) | 32.4% | 31.7% |
| Standard Deviation (Population) | 32.1% | 31.4% |
Similar Demographics by Single Father Poverty
Demographics Similar to Scottish by Single Father Poverty
In terms of single father poverty, the demographic groups most similar to Scottish are Iroquois (17.7%, a difference of 0.050%), German (17.7%, a difference of 0.19%), Lebanese (17.7%, a difference of 0.20%), English (17.8%, a difference of 0.32%), and Dutch (17.8%, a difference of 0.32%).
| Demographics | Rating | Rank | Single Father Poverty |
| Italians | 0.1 /100 | #273 | Tragic 17.5% |
| Macedonians | 0.1 /100 | #274 | Tragic 17.7% |
| British West Indians | 0.0 /100 | #275 | Tragic 17.7% |
| German Russians | 0.0 /100 | #276 | Tragic 17.7% |
| Lebanese | 0.0 /100 | #277 | Tragic 17.7% |
| Germans | 0.0 /100 | #278 | Tragic 17.7% |
| Iroquois | 0.0 /100 | #279 | Tragic 17.7% |
| Scottish | 0.0 /100 | #280 | Tragic 17.7% |
| English | 0.0 /100 | #281 | Tragic 17.8% |
| Dutch | 0.0 /100 | #282 | Tragic 17.8% |
| Alsatians | 0.0 /100 | #283 | Tragic 17.8% |
| Welsh | 0.0 /100 | #284 | Tragic 17.8% |
| Immigrants | Lebanon | 0.0 /100 | #285 | Tragic 17.9% |
| Immigrants | North Macedonia | 0.0 /100 | #286 | Tragic 17.9% |
| Carpatho Rusyns | 0.0 /100 | #287 | Tragic 18.0% |
Demographics Similar to Central American Indians by Single Father Poverty
In terms of single father poverty, the demographic groups most similar to Central American Indians are Paiute (21.6%, a difference of 0.27%), Tohono O'odham (22.0%, a difference of 1.5%), Colville (21.4%, a difference of 1.5%), Pueblo (21.1%, a difference of 2.6%), and Native/Alaskan (22.4%, a difference of 3.3%).
| Demographics | Rating | Rank | Single Father Poverty |
| Americans | 0.0 /100 | #324 | Tragic 20.1% |
| Blacks/African Americans | 0.0 /100 | #325 | Tragic 20.4% |
| Immigrants | Yemen | 0.0 /100 | #326 | Tragic 20.6% |
| Choctaw | 0.0 /100 | #327 | Tragic 20.7% |
| Pueblo | 0.0 /100 | #328 | Tragic 21.1% |
| Colville | 0.0 /100 | #329 | Tragic 21.4% |
| Paiute | 0.0 /100 | #330 | Tragic 21.6% |
| Central American Indians | 0.0 /100 | #331 | Tragic 21.7% |
| Tohono O'odham | 0.0 /100 | #332 | Tragic 22.0% |
| Natives/Alaskans | 0.0 /100 | #333 | Tragic 22.4% |
| Kiowa | 0.0 /100 | #334 | Tragic 22.5% |
| Shoshone | 0.0 /100 | #335 | Tragic 22.9% |
| Cajuns | 0.0 /100 | #336 | Tragic 23.1% |
| Sioux | 0.0 /100 | #337 | Tragic 23.9% |
| Arapaho | 0.0 /100 | #338 | Tragic 24.0% |