Spanish American vs Greek No Vehicles in Household
COMPARE
Spanish American
Greek
No Vehicles in Household
No Vehicles in Household Comparison
Spanish Americans
Greeks
9.1%
NO VEHICLES IN HOUSEHOLD
97.9/ 100
METRIC RATING
105th/ 347
METRIC RANK
9.5%
NO VEHICLES IN HOUSEHOLD
92.9/ 100
METRIC RATING
118th/ 347
METRIC RANK
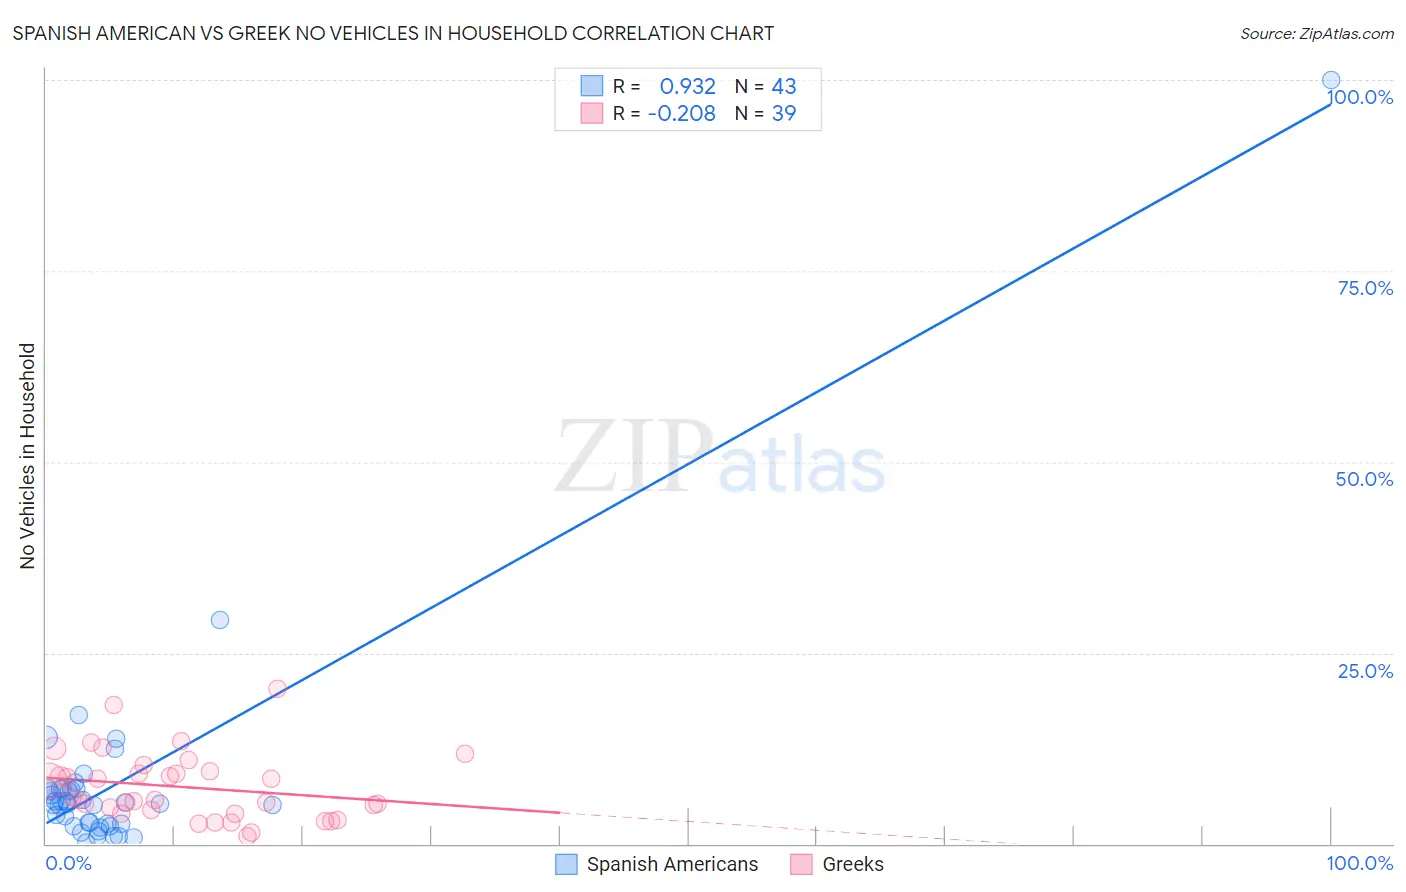
Spanish American vs Greek No Vehicles in Household Correlation Chart
The statistical analysis conducted on geographies consisting of 103,117,894 people shows a near-perfect positive correlation between the proportion of Spanish Americans and percentage of households with no vehicle available in the United States with a correlation coefficient (R) of 0.932 and weighted average of 9.1%. Similarly, the statistical analysis conducted on geographies consisting of 480,584,341 people shows a weak negative correlation between the proportion of Greeks and percentage of households with no vehicle available in the United States with a correlation coefficient (R) of -0.208 and weighted average of 9.5%, a difference of 4.9%.
No Vehicles in Household Correlation Summary
| Measurement | Spanish American | Greek |
| Minimum | 0.089% | 1.00% |
| Maximum | 100.0% | 20.3% |
| Range | 99.9% | 19.3% |
| Mean | 8.1% | 7.4% |
| Median | 5.3% | 5.7% |
| Interquartile 25% (IQ1) | 2.6% | 4.0% |
| Interquartile 75% (IQ3) | 7.1% | 9.5% |
| Interquartile Range (IQR) | 4.6% | 5.5% |
| Standard Deviation (Sample) | 15.2% | 4.4% |
| Standard Deviation (Population) | 15.1% | 4.4% |
Demographics Similar to Spanish Americans and Greeks by No Vehicles in Household
In terms of no vehicles in household, the demographic groups most similar to Spanish Americans are Laotian (9.1%, a difference of 0.090%), Zimbabwean (9.0%, a difference of 0.16%), Hispanic or Latino (9.1%, a difference of 0.36%), Mexican American Indian (9.1%, a difference of 0.44%), and Maltese (9.1%, a difference of 0.57%). Similarly, the demographic groups most similar to Greeks are Fijian (9.5%, a difference of 0.11%), Immigrants from Thailand (9.5%, a difference of 0.17%), Puget Sound Salish (9.5%, a difference of 0.27%), Chippewa (9.4%, a difference of 0.55%), and Japanese (9.4%, a difference of 0.72%).
| Demographics | Rating | Rank | No Vehicles in Household |
| Pakistanis | 98.3 /100 | #101 | Exceptional 9.0% |
| Yugoslavians | 98.3 /100 | #102 | Exceptional 9.0% |
| Seminole | 98.3 /100 | #103 | Exceptional 9.0% |
| Zimbabweans | 98.0 /100 | #104 | Exceptional 9.0% |
| Spanish Americans | 97.9 /100 | #105 | Exceptional 9.1% |
| Laotians | 97.8 /100 | #106 | Exceptional 9.1% |
| Hispanics or Latinos | 97.7 /100 | #107 | Exceptional 9.1% |
| Mexican American Indians | 97.6 /100 | #108 | Exceptional 9.1% |
| Maltese | 97.6 /100 | #109 | Exceptional 9.1% |
| Delaware | 97.2 /100 | #110 | Exceptional 9.2% |
| Immigrants | Kuwait | 95.1 /100 | #111 | Exceptional 9.4% |
| Armenians | 95.0 /100 | #112 | Exceptional 9.4% |
| Immigrants | Netherlands | 94.8 /100 | #113 | Exceptional 9.4% |
| Serbians | 94.3 /100 | #114 | Exceptional 9.4% |
| Navajo | 94.2 /100 | #115 | Exceptional 9.4% |
| Japanese | 94.1 /100 | #116 | Exceptional 9.4% |
| Chippewa | 93.8 /100 | #117 | Exceptional 9.4% |
| Greeks | 92.9 /100 | #118 | Exceptional 9.5% |
| Fijians | 92.7 /100 | #119 | Exceptional 9.5% |
| Immigrants | Thailand | 92.6 /100 | #120 | Exceptional 9.5% |
| Puget Sound Salish | 92.4 /100 | #121 | Exceptional 9.5% |