Scandinavian vs Immigrants from France Single Male Poverty
COMPARE
Scandinavian
Immigrants from France
Single Male Poverty
Single Male Poverty Comparison
Scandinavians
Immigrants from France
13.1%
SINGLE MALE POVERTY
12.9/ 100
METRIC RATING
218th/ 347
METRIC RANK
12.6%
SINGLE MALE POVERTY
75.8/ 100
METRIC RATING
143rd/ 347
METRIC RANK
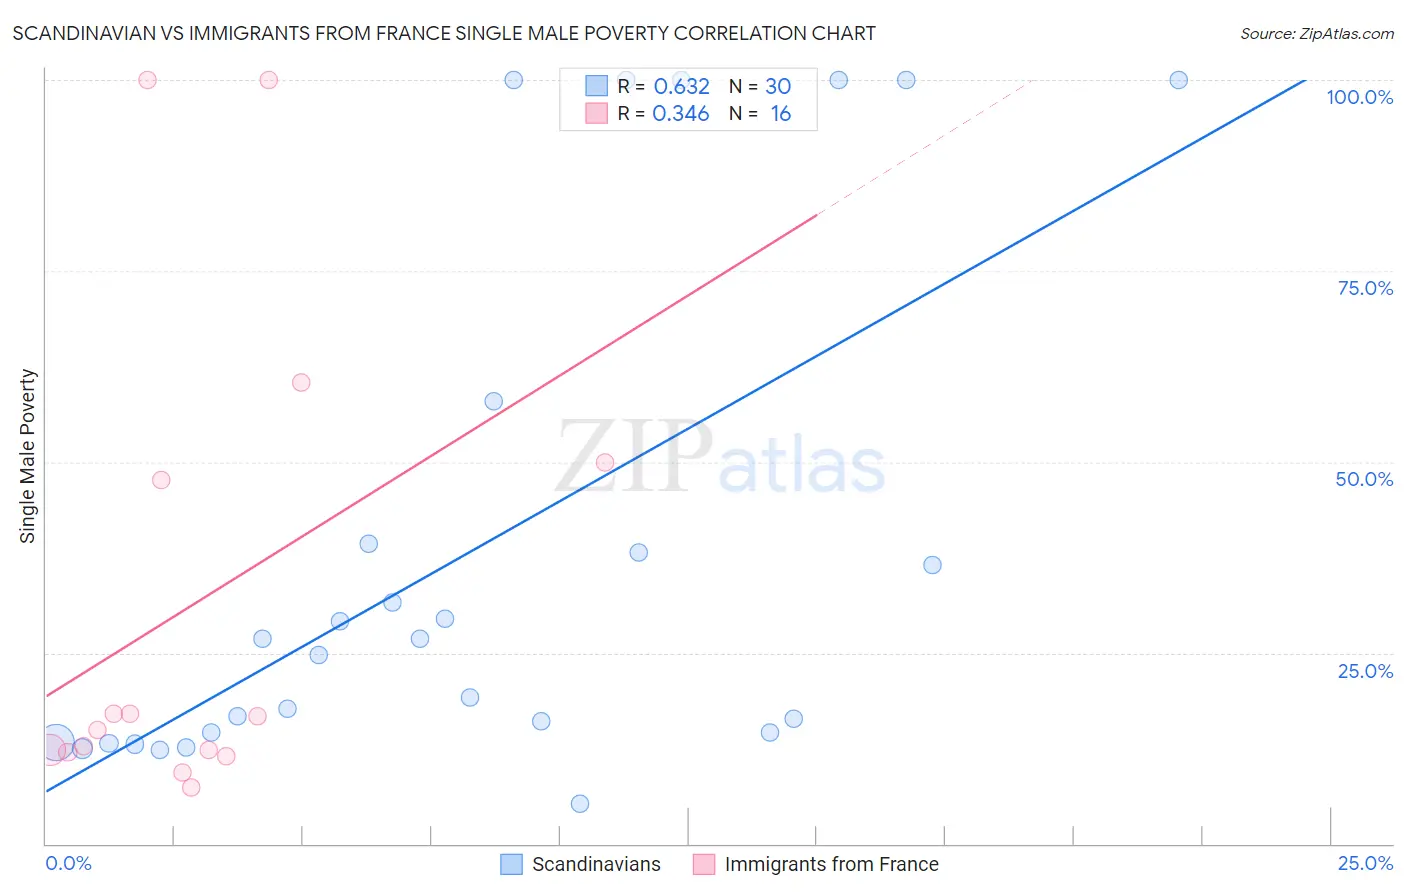
Scandinavian vs Immigrants from France Single Male Poverty Correlation Chart
The statistical analysis conducted on geographies consisting of 403,484,518 people shows a significant positive correlation between the proportion of Scandinavians and poverty level among single males in the United States with a correlation coefficient (R) of 0.632 and weighted average of 13.1%. Similarly, the statistical analysis conducted on geographies consisting of 259,237,479 people shows a mild positive correlation between the proportion of Immigrants from France and poverty level among single males in the United States with a correlation coefficient (R) of 0.346 and weighted average of 12.6%, a difference of 4.1%.
Single Male Poverty Correlation Summary
| Measurement | Scandinavian | Immigrants from France |
| Minimum | 5.2% | 7.4% |
| Maximum | 100.0% | 100.0% |
| Range | 94.8% | 92.6% |
| Mean | 37.9% | 31.3% |
| Median | 25.7% | 15.8% |
| Interquartile 25% (IQ1) | 14.5% | 12.1% |
| Interquartile 75% (IQ3) | 39.3% | 48.8% |
| Interquartile Range (IQR) | 24.8% | 36.7% |
| Standard Deviation (Sample) | 33.3% | 31.3% |
| Standard Deviation (Population) | 32.8% | 30.3% |
Similar Demographics by Single Male Poverty
Demographics Similar to Scandinavians by Single Male Poverty
In terms of single male poverty, the demographic groups most similar to Scandinavians are Bermudan (13.1%, a difference of 0.020%), Immigrants from Burma/Myanmar (13.1%, a difference of 0.030%), Austrian (13.1%, a difference of 0.11%), Japanese (13.1%, a difference of 0.21%), and Zimbabwean (13.1%, a difference of 0.22%).
| Demographics | Rating | Rank | Single Male Poverty |
| Swedes | 16.8 /100 | #211 | Poor 13.1% |
| Senegalese | 16.4 /100 | #212 | Poor 13.1% |
| Italians | 15.9 /100 | #213 | Poor 13.1% |
| Zimbabweans | 14.9 /100 | #214 | Poor 13.1% |
| Japanese | 14.8 /100 | #215 | Poor 13.1% |
| Austrians | 13.9 /100 | #216 | Poor 13.1% |
| Bermudans | 13.0 /100 | #217 | Poor 13.1% |
| Scandinavians | 12.9 /100 | #218 | Poor 13.1% |
| Immigrants | Burma/Myanmar | 12.6 /100 | #219 | Poor 13.1% |
| Central Americans | 10.9 /100 | #220 | Poor 13.2% |
| New Zealanders | 10.7 /100 | #221 | Poor 13.2% |
| Immigrants | Western Europe | 10.0 /100 | #222 | Poor 13.2% |
| Immigrants | Azores | 9.3 /100 | #223 | Tragic 13.2% |
| Somalis | 9.1 /100 | #224 | Tragic 13.2% |
| Immigrants | Denmark | 8.7 /100 | #225 | Tragic 13.2% |
Demographics Similar to Immigrants from France by Single Male Poverty
In terms of single male poverty, the demographic groups most similar to Immigrants from France are Okinawan (12.6%, a difference of 0.010%), Immigrants from Uganda (12.6%, a difference of 0.010%), Hawaiian (12.6%, a difference of 0.050%), Immigrants from Lebanon (12.6%, a difference of 0.060%), and Native Hawaiian (12.6%, a difference of 0.060%).
| Demographics | Rating | Rank | Single Male Poverty |
| Immigrants | Austria | 81.9 /100 | #136 | Excellent 12.5% |
| Ukrainians | 80.7 /100 | #137 | Excellent 12.6% |
| Immigrants | El Salvador | 80.0 /100 | #138 | Excellent 12.6% |
| Cubans | 79.9 /100 | #139 | Good 12.6% |
| Immigrants | Zimbabwe | 78.0 /100 | #140 | Good 12.6% |
| Okinawans | 75.9 /100 | #141 | Good 12.6% |
| Immigrants | Uganda | 75.9 /100 | #142 | Good 12.6% |
| Immigrants | France | 75.8 /100 | #143 | Good 12.6% |
| Hawaiians | 75.1 /100 | #144 | Good 12.6% |
| Immigrants | Lebanon | 75.0 /100 | #145 | Good 12.6% |
| Native Hawaiians | 75.0 /100 | #146 | Good 12.6% |
| Malaysians | 74.8 /100 | #147 | Good 12.6% |
| Yugoslavians | 73.9 /100 | #148 | Good 12.6% |
| Sierra Leoneans | 73.0 /100 | #149 | Good 12.6% |
| Immigrants | Panama | 72.1 /100 | #150 | Good 12.6% |