Immigrants from Jordan vs Immigrants from the Azores No Vehicles in Household
COMPARE
Immigrants from Jordan
Immigrants from the Azores
No Vehicles in Household
No Vehicles in Household Comparison
Immigrants from Jordan
Immigrants from the Azores
8.7%
NO VEHICLES IN HOUSEHOLD
99.3/ 100
METRIC RATING
84th/ 347
METRIC RANK
9.7%
NO VEHICLES IN HOUSEHOLD
88.2/ 100
METRIC RATING
131st/ 347
METRIC RANK
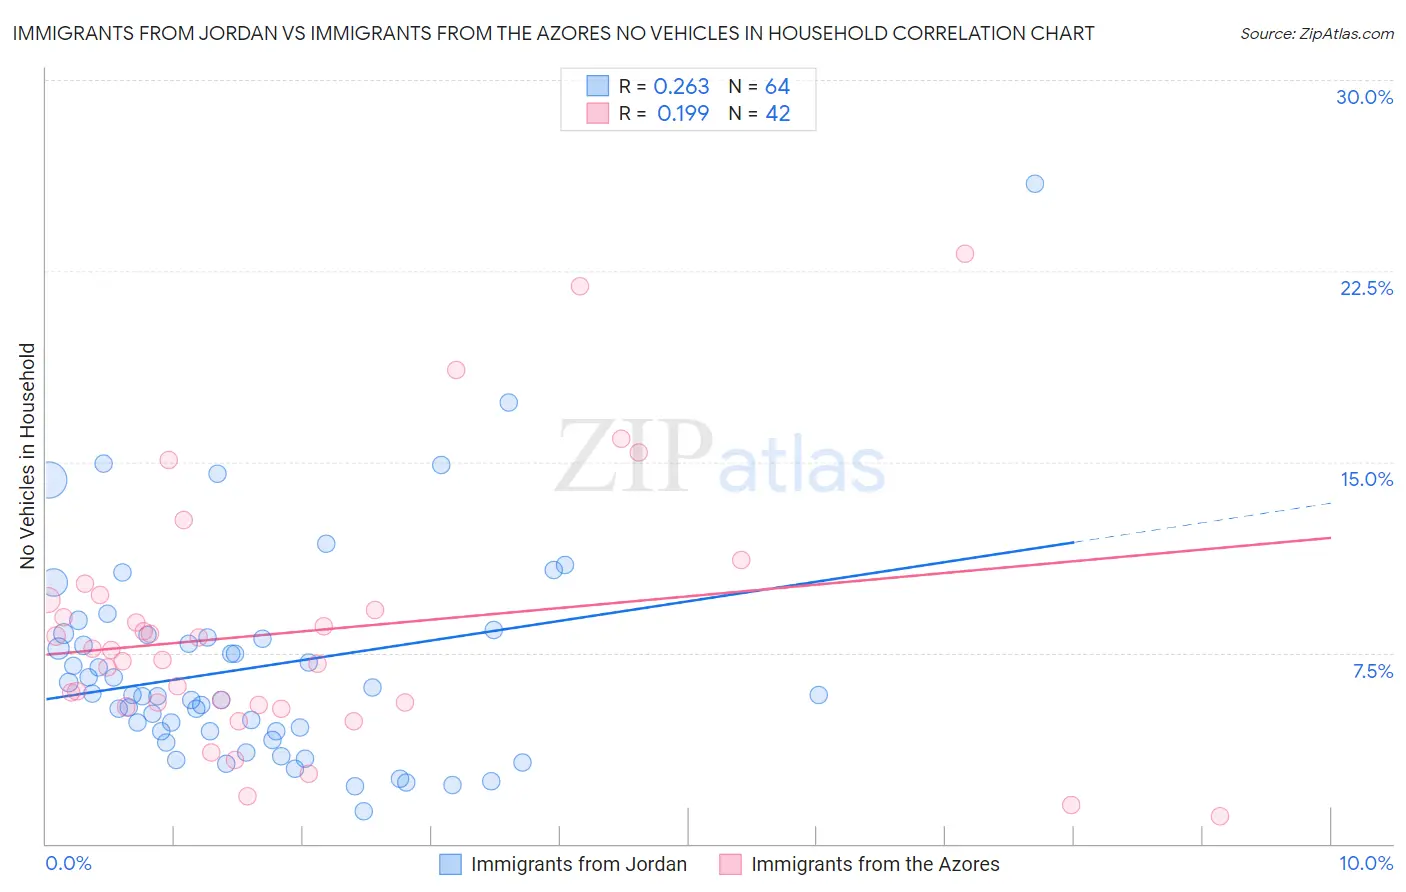
Immigrants from Jordan vs Immigrants from the Azores No Vehicles in Household Correlation Chart
The statistical analysis conducted on geographies consisting of 181,152,945 people shows a weak positive correlation between the proportion of Immigrants from Jordan and percentage of households with no vehicle available in the United States with a correlation coefficient (R) of 0.263 and weighted average of 8.7%. Similarly, the statistical analysis conducted on geographies consisting of 46,204,339 people shows a poor positive correlation between the proportion of Immigrants from the Azores and percentage of households with no vehicle available in the United States with a correlation coefficient (R) of 0.199 and weighted average of 9.7%, a difference of 12.1%.
No Vehicles in Household Correlation Summary
| Measurement | Immigrants from Jordan | Immigrants from the Azores |
| Minimum | 1.3% | 1.1% |
| Maximum | 25.9% | 23.2% |
| Range | 24.6% | 22.1% |
| Mean | 6.9% | 8.3% |
| Median | 5.9% | 7.4% |
| Interquartile 25% (IQ1) | 4.4% | 5.4% |
| Interquartile 75% (IQ3) | 8.1% | 9.6% |
| Interquartile Range (IQR) | 3.7% | 4.2% |
| Standard Deviation (Sample) | 4.2% | 5.0% |
| Standard Deviation (Population) | 4.2% | 4.9% |
Similar Demographics by No Vehicles in Household
Demographics Similar to Immigrants from Jordan by No Vehicles in Household
In terms of no vehicles in household, the demographic groups most similar to Immigrants from Jordan are Lebanese (8.7%, a difference of 0.060%), Bangladeshi (8.7%, a difference of 0.16%), Italian (8.6%, a difference of 0.25%), Immigrants from England (8.7%, a difference of 0.39%), and Osage (8.7%, a difference of 0.51%).
| Demographics | Rating | Rank | No Vehicles in Household |
| Iranians | 99.5 /100 | #77 | Exceptional 8.6% |
| Immigrants | South Central Asia | 99.5 /100 | #78 | Exceptional 8.6% |
| Portuguese | 99.5 /100 | #79 | Exceptional 8.6% |
| Bolivians | 99.4 /100 | #80 | Exceptional 8.6% |
| Tsimshian | 99.4 /100 | #81 | Exceptional 8.6% |
| Immigrants | South Eastern Asia | 99.4 /100 | #82 | Exceptional 8.6% |
| Italians | 99.4 /100 | #83 | Exceptional 8.6% |
| Immigrants | Jordan | 99.3 /100 | #84 | Exceptional 8.7% |
| Lebanese | 99.3 /100 | #85 | Exceptional 8.7% |
| Bangladeshis | 99.3 /100 | #86 | Exceptional 8.7% |
| Immigrants | England | 99.2 /100 | #87 | Exceptional 8.7% |
| Osage | 99.2 /100 | #88 | Exceptional 8.7% |
| Immigrants | Cuba | 99.2 /100 | #89 | Exceptional 8.7% |
| Bhutanese | 99.2 /100 | #90 | Exceptional 8.7% |
| Immigrants | Germany | 99.1 /100 | #91 | Exceptional 8.7% |
Demographics Similar to Immigrants from the Azores by No Vehicles in Household
In terms of no vehicles in household, the demographic groups most similar to Immigrants from the Azores are Kenyan (9.7%, a difference of 0.070%), Burmese (9.7%, a difference of 0.20%), Immigrants from Oceania (9.7%, a difference of 0.37%), Syrian (9.7%, a difference of 0.39%), and Nicaraguan (9.7%, a difference of 0.46%).
| Demographics | Rating | Rank | No Vehicles in Household |
| Immigrants | Korea | 90.9 /100 | #124 | Exceptional 9.6% |
| Immigrants | Cameroon | 90.6 /100 | #125 | Exceptional 9.6% |
| Icelanders | 90.2 /100 | #126 | Exceptional 9.6% |
| Immigrants | Kenya | 89.7 /100 | #127 | Excellent 9.6% |
| Immigrants | Syria | 89.5 /100 | #128 | Excellent 9.6% |
| Nicaraguans | 89.5 /100 | #129 | Excellent 9.7% |
| Burmese | 88.8 /100 | #130 | Excellent 9.7% |
| Immigrants | Azores | 88.2 /100 | #131 | Excellent 9.7% |
| Kenyans | 88.0 /100 | #132 | Excellent 9.7% |
| Immigrants | Oceania | 87.1 /100 | #133 | Excellent 9.7% |
| Syrians | 87.1 /100 | #134 | Excellent 9.7% |
| Latvians | 85.1 /100 | #135 | Excellent 9.8% |
| Immigrants | South Africa | 85.0 /100 | #136 | Excellent 9.8% |
| Immigrants | Moldova | 84.6 /100 | #137 | Excellent 9.8% |
| Estonians | 84.2 /100 | #138 | Excellent 9.8% |