Salvadoran vs Immigrants from the Azores Unemployment Among Women with Children Ages 6 to 17 years
COMPARE
Salvadoran
Immigrants from the Azores
Unemployment Among Women with Children Ages 6 to 17 years
Unemployment Among Women with Children Ages 6 to 17 years Comparison
Salvadorans
Immigrants from the Azores
9.2%
UNEMPLOYMENT AMONG WOMEN WITH CHILDREN AGES 6 TO 17 YEARS
10.7/ 100
METRIC RATING
209th/ 347
METRIC RANK
9.3%
UNEMPLOYMENT AMONG WOMEN WITH CHILDREN AGES 6 TO 17 YEARS
4.6/ 100
METRIC RATING
226th/ 347
METRIC RANK
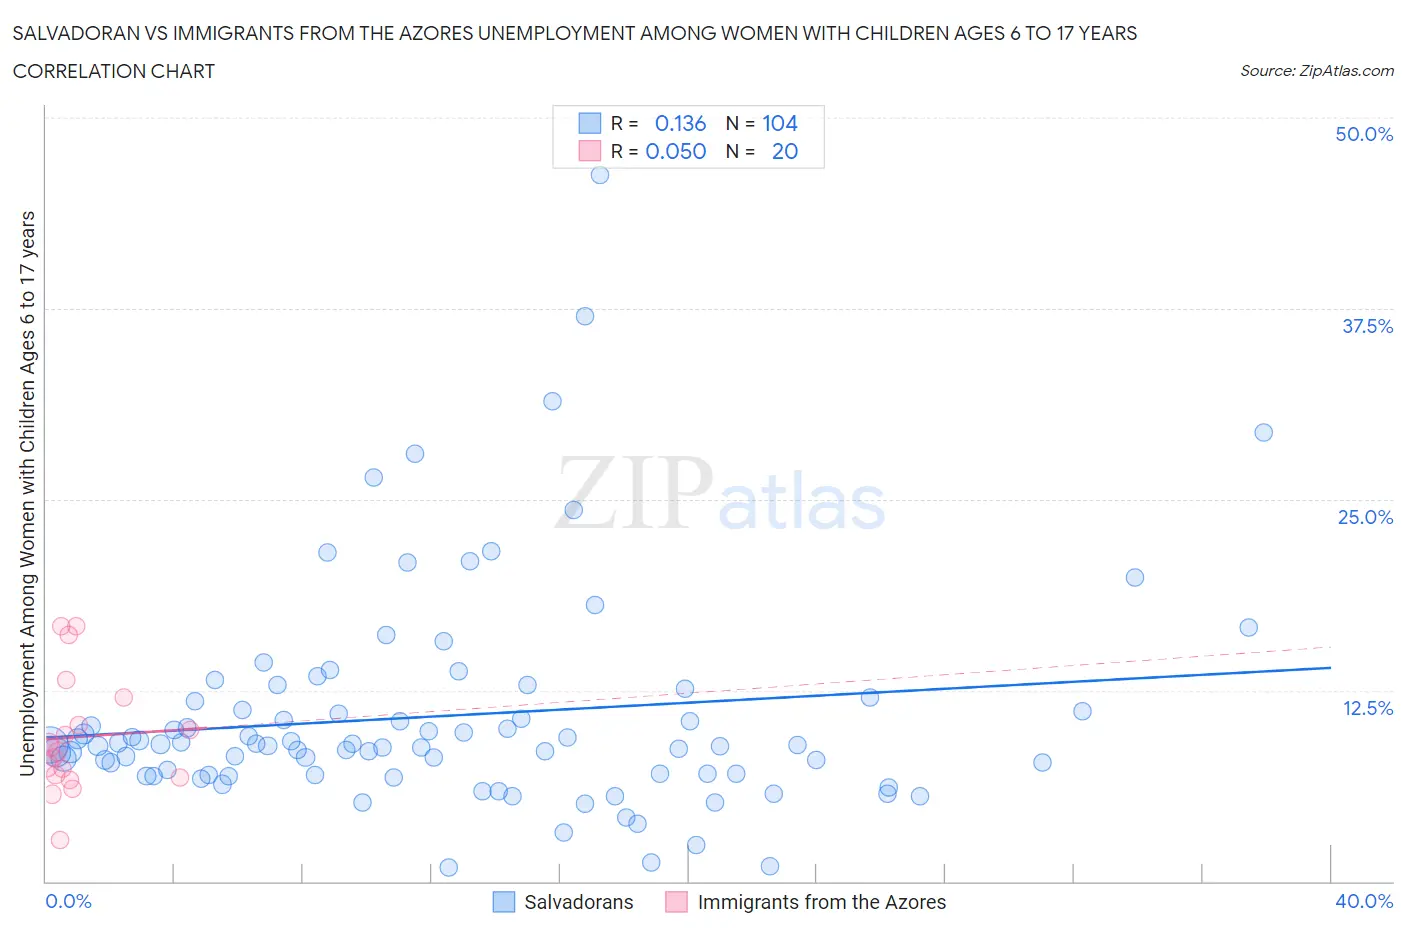
Salvadoran vs Immigrants from the Azores Unemployment Among Women with Children Ages 6 to 17 years Correlation Chart
The statistical analysis conducted on geographies consisting of 294,326,851 people shows a poor positive correlation between the proportion of Salvadorans and unemployment rate among women with children between the ages 6 and 17 in the United States with a correlation coefficient (R) of 0.136 and weighted average of 9.2%. Similarly, the statistical analysis conducted on geographies consisting of 39,080,392 people shows no correlation between the proportion of Immigrants from the Azores and unemployment rate among women with children between the ages 6 and 17 in the United States with a correlation coefficient (R) of 0.050 and weighted average of 9.3%, a difference of 0.99%.
Unemployment Among Women with Children Ages 6 to 17 years Correlation Summary
| Measurement | Salvadoran | Immigrants from the Azores |
| Minimum | 0.90% | 2.7% |
| Maximum | 46.2% | 16.7% |
| Range | 45.3% | 14.0% |
| Mean | 10.8% | 9.4% |
| Median | 8.9% | 8.6% |
| Interquartile 25% (IQ1) | 7.0% | 6.9% |
| Interquartile 75% (IQ3) | 11.5% | 11.1% |
| Interquartile Range (IQR) | 4.5% | 4.2% |
| Standard Deviation (Sample) | 7.2% | 3.8% |
| Standard Deviation (Population) | 7.1% | 3.7% |
Demographics Similar to Salvadorans and Immigrants from the Azores by Unemployment Among Women with Children Ages 6 to 17 years
In terms of unemployment among women with children ages 6 to 17 years, the demographic groups most similar to Salvadorans are Cuban (9.2%, a difference of 0.010%), Immigrants from Peru (9.2%, a difference of 0.010%), Finnish (9.2%, a difference of 0.090%), Immigrants from Cuba (9.2%, a difference of 0.14%), and Peruvian (9.2%, a difference of 0.22%). Similarly, the demographic groups most similar to Immigrants from the Azores are Panamanian (9.3%, a difference of 0.020%), Chinese (9.3%, a difference of 0.14%), Immigrants from El Salvador (9.3%, a difference of 0.15%), Immigrants from Eritrea (9.2%, a difference of 0.25%), and Immigrants from Southern Europe (9.2%, a difference of 0.26%).
| Demographics | Rating | Rank | Unemployment Among Women with Children Ages 6 to 17 years |
| Cubans | 10.9 /100 | #207 | Poor 9.2% |
| Immigrants | Peru | 10.8 /100 | #208 | Poor 9.2% |
| Salvadorans | 10.7 /100 | #209 | Poor 9.2% |
| Finns | 10.0 /100 | #210 | Tragic 9.2% |
| Immigrants | Cuba | 9.6 /100 | #211 | Tragic 9.2% |
| Peruvians | 9.0 /100 | #212 | Tragic 9.2% |
| Spaniards | 8.2 /100 | #213 | Tragic 9.2% |
| Iroquois | 7.5 /100 | #214 | Tragic 9.2% |
| Immigrants | Germany | 7.2 /100 | #215 | Tragic 9.2% |
| Immigrants | Uruguay | 7.2 /100 | #216 | Tragic 9.2% |
| Germans | 7.2 /100 | #217 | Tragic 9.2% |
| Syrians | 6.9 /100 | #218 | Tragic 9.2% |
| Immigrants | Scotland | 6.6 /100 | #219 | Tragic 9.2% |
| Belgians | 6.4 /100 | #220 | Tragic 9.2% |
| Crow | 5.8 /100 | #221 | Tragic 9.2% |
| Immigrants | Southern Europe | 5.8 /100 | #222 | Tragic 9.2% |
| Immigrants | Eritrea | 5.8 /100 | #223 | Tragic 9.2% |
| Immigrants | El Salvador | 5.3 /100 | #224 | Tragic 9.3% |
| Chinese | 5.2 /100 | #225 | Tragic 9.3% |
| Immigrants | Azores | 4.6 /100 | #226 | Tragic 9.3% |
| Panamanians | 4.5 /100 | #227 | Tragic 9.3% |