Salvadoran vs Immigrants from the Azores Per Capita Income
COMPARE
Salvadoran
Immigrants from the Azores
Per Capita Income
Per Capita Income Comparison
Salvadorans
Immigrants from the Azores
$38,858
PER CAPITA INCOME
0.5/ 100
METRIC RATING
266th/ 347
METRIC RANK
$39,608
PER CAPITA INCOME
1.0/ 100
METRIC RATING
252nd/ 347
METRIC RANK
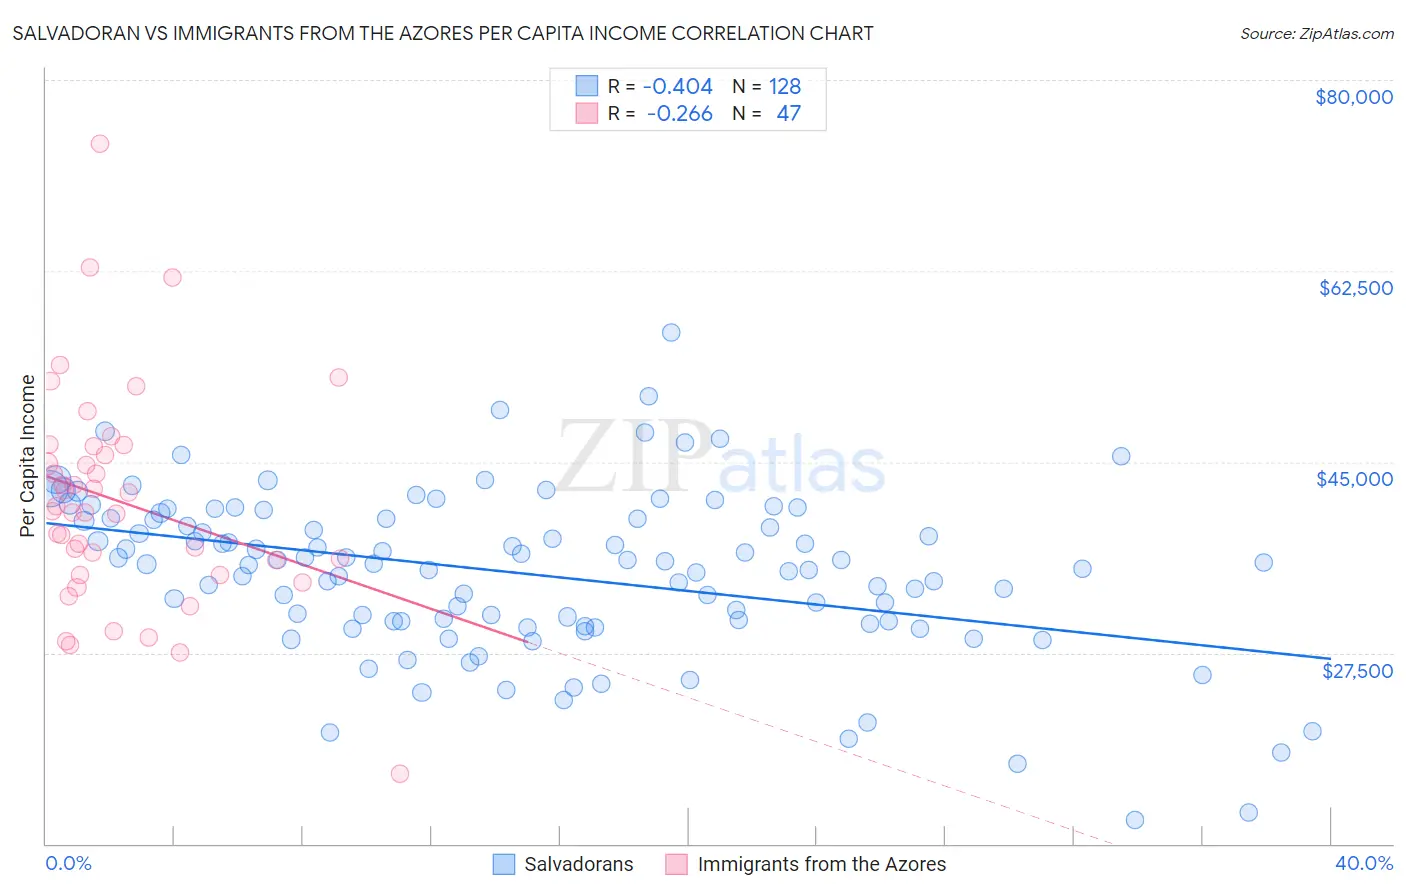
Salvadoran vs Immigrants from the Azores Per Capita Income Correlation Chart
The statistical analysis conducted on geographies consisting of 399,090,197 people shows a moderate negative correlation between the proportion of Salvadorans and per capita income in the United States with a correlation coefficient (R) of -0.404 and weighted average of $38,858. Similarly, the statistical analysis conducted on geographies consisting of 46,254,060 people shows a weak negative correlation between the proportion of Immigrants from the Azores and per capita income in the United States with a correlation coefficient (R) of -0.266 and weighted average of $39,608, a difference of 1.9%.
Per Capita Income Correlation Summary
| Measurement | Salvadoran | Immigrants from the Azores |
| Minimum | $12,183 | $16,377 |
| Maximum | $56,804 | $74,187 |
| Range | $44,621 | $57,810 |
| Mean | $34,754 | $41,323 |
| Median | $35,664 | $40,470 |
| Interquartile 25% (IQ1) | $30,375 | $34,672 |
| Interquartile 75% (IQ3) | $39,784 | $46,446 |
| Interquartile Range (IQR) | $9,409 | $11,774 |
| Standard Deviation (Sample) | $7,521 | $10,106 |
| Standard Deviation (Population) | $7,492 | $9,998 |
Demographics Similar to Salvadorans and Immigrants from the Azores by Per Capita Income
In terms of per capita income, the demographic groups most similar to Salvadorans are Immigrants from Zaire ($38,848, a difference of 0.030%), Liberian ($38,780, a difference of 0.20%), Immigrants from Jamaica ($38,766, a difference of 0.24%), Spanish American ($39,012, a difference of 0.40%), and American ($39,039, a difference of 0.47%). Similarly, the demographic groups most similar to Immigrants from the Azores are Osage ($39,568, a difference of 0.10%), Alaska Native ($39,558, a difference of 0.13%), Immigrants from Middle Africa ($39,529, a difference of 0.20%), Hawaiian ($39,403, a difference of 0.52%), and Immigrants from Burma/Myanmar ($39,827, a difference of 0.55%).
| Demographics | Rating | Rank | Per Capita Income |
| Japanese | 1.4 /100 | #249 | Tragic $39,870 |
| Immigrants | Burma/Myanmar | 1.3 /100 | #250 | Tragic $39,827 |
| Samoans | 1.3 /100 | #251 | Tragic $39,826 |
| Immigrants | Azores | 1.0 /100 | #252 | Tragic $39,608 |
| Osage | 1.0 /100 | #253 | Tragic $39,568 |
| Alaska Natives | 1.0 /100 | #254 | Tragic $39,558 |
| Immigrants | Middle Africa | 1.0 /100 | #255 | Tragic $39,529 |
| Hawaiians | 0.8 /100 | #256 | Tragic $39,403 |
| Nicaraguans | 0.8 /100 | #257 | Tragic $39,372 |
| Jamaicans | 0.7 /100 | #258 | Tragic $39,231 |
| Malaysians | 0.7 /100 | #259 | Tragic $39,194 |
| Alaskan Athabascans | 0.6 /100 | #260 | Tragic $39,163 |
| Marshallese | 0.6 /100 | #261 | Tragic $39,108 |
| Iroquois | 0.6 /100 | #262 | Tragic $39,104 |
| Belizeans | 0.6 /100 | #263 | Tragic $39,097 |
| Americans | 0.6 /100 | #264 | Tragic $39,039 |
| Spanish Americans | 0.5 /100 | #265 | Tragic $39,012 |
| Salvadorans | 0.5 /100 | #266 | Tragic $38,858 |
| Immigrants | Zaire | 0.4 /100 | #267 | Tragic $38,848 |
| Liberians | 0.4 /100 | #268 | Tragic $38,780 |
| Immigrants | Jamaica | 0.4 /100 | #269 | Tragic $38,766 |